Advertisements
Advertisements
Question
The bar graph given below represents the circulation of newspapers (dailies) in a town in six languages (the figures are approximated to hundreds).

Study the bar graph and answer the following questions:
- Find the total number of newspapers read in Hindi, Punjabi, Urdu, Marathi and Tamil.
- Find the excess number of newspapers read in Hindi than those in English.
- Name the language in which the least number of newspapers are read.
- Write the total circulation of newspapers in the town.
Solution
Number of newspapers in Urdu = 200
Number of newspapers in Tamil = 100
Number of newspapers in English = 500
Number of newspapers in Hindi = 800
Number of newspapers in Marathi = 300
Number of newspapers in Punjabi = 400
a. Total number of newspapers read in Hindi, Punjab, Urdu, Marathi and Tamil
= 800 + 400 + 200 + 300 + 100
= 1800
b. Excess number of newspapers read in Hindi than those in English
= Number of newspapers read in Hindi – Number of newspapers read in English
= 800 – 500
= 300
c. Out of all the newspapers, least number of newspapers in Tamil, i.e. 100 newspapers are read.
d. Total circulation of newspapers in the town.
= Number of newspapers in six different languages
= 200 + 100 + 500 + 800 + 300 + 400
= 2300
APPEARS IN
RELATED QUESTIONS
The following chart gives the growth in height in terms of percentage of full height of boys and girls with their respective ages.
| Age (in years) | 8 | 9 | 10 | 11 | 12 | 13 | 14 | 15 | 16 | 17 |
18 |
| Boys | 72% | 75% | 78% | 81% | 84% | 88% | 92% | 95% | 98% | 99% | 100% |
| Girls | 77% | 81% | 84% | 88% | 91% | 95% | 98% | 99% | 99.5% | 100% | 100% |
Draw the line graph of above data on the same sheet and answer the following questions.
- In which year both the boys and the girls achieve their maximum height?
- Who grows faster at puberty (14 years to 16 years of age)?
In a bar graph, the width of bars may be unequal.
To represent the population of different towns using bar graph, it is convenient to take one unit length to represent one person.
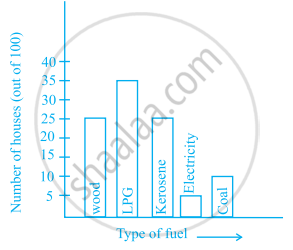
The following bar graph shows the number of houses (out of 100) in a town using different types of fuels for cooking.
Read the bar graph and answer the following questions:
Scale: 1 unit length = 5 houses
(a) Which fuel is used in maximum number of houses?
(b) How many houses are using coal as fuel?
(c) Suppose that the total number of houses in the town is 1 lakh.
From the above graph estimate the number of houses using electricity.
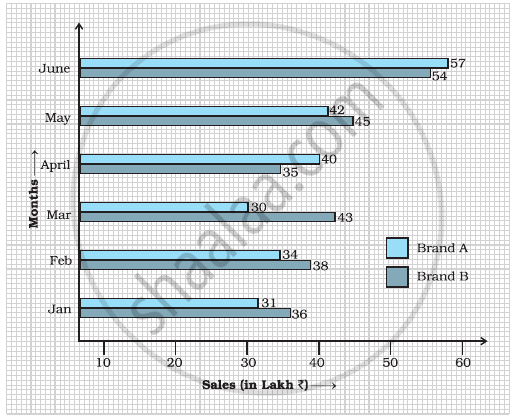
Study the double bar graph shown below and answer the questions that follow:

- What information is represented by the above double bar graph?
- In which month sales of Brand A decreased as compared to the previous month?
- What is the difference in sales of both the Brands for the month of June?
- Find the average sales of Brand B for the six months.
- List all months for which the sales of Brand B was less than that of Brand A.
- Find the ratio of sales of Brand A as compared to Brand B for the month of January.
The following table shows the average intake of nutrients in calories by rural and urban groups in a particular year. Using a suitable scale for the given data, draw a double bar graph to compare the data.
| Foodstuff | Rural | Urban |
| Pulses | 35 | 49 |
| Leafy vegetables | 14 | 21 |
| Other vegetables | 51 | 89 |
| Fruits | 35 | 66 |
| Milk | 70 | 250 |
| Fish and flesh floods | 10 | 22 |
| Fats and Oils | 9 | 35 |
| Sugar/Jaggery | 19 | 31 |
In a public library, the following observations were recorded by the librarian in a particular week:
| Days | Mon | Tues | Wed | Thurs | Fri | Sat |
| Newspaper Readers |
400 | 600 | 350 | 550 | 500 | 350 |
| Magazines Readers |
150 | 100 | 200 | 300 | 250 | 200 |
- Draw a double bar graph choosing an appropriate scale.
- On which day, the number of readers in the library was maximum?
- What is the mean number of magazine readers?
The marks out of 100 obtained by Kunal and Soni in the Half Yearly Examination are given below:
| Subjects | English | Hindi | Maths | Science | S. Science | Sanskirt |
| Kunal | 72 | 81 | 92 | 96 | 64 | 85 |
| Soni | 86 | 89 | 90 | 82 | 75 | 82 |
- Draw a double bar graph by choosing appropriate scale.
- Calculate the total percentage of marks obtained by Soni.
- Calculate the total percentage of marks obtained by Kunal.
- Compare the percentages of marks obtained by Kunal and Soni.
- In how many subjects did Soni get more marks than Kunal? Which are those subjects?
- Who got more marks in S. Science and what was the difference of marks?
- In which subject the difference of marks was maximum and by how much?
The table below compares the population (in hundreds) of 4 towns over two years:
| Towns | A | B | C | D |
| 2007 | 2900 | 6400 | 8300 | 4600 |
| 2009 | 3200 | 7500 | 9200 | 6300 |
Study the table and answer the following questions:
- Draw a double bar graph using appropriate scale to depict the above information.
- In which town was the population growth maximum?
- In which town was the population growth least?
The table below gives the flavours of ice cream liked by children (boys and girls) of a society.
| Flavours | Vanilla | Chocolate | Strawberry | Mango | Butterscotch |
| Boys | 4 | 9 | 3 | 8 | 13 |
| Girls | 8 | 12 | 7 | 9 | 10 |
Study the table and answer the following questions:
- Draw a double bar graph using appropriate scale to represent the above information.
- Which flavour is liked the most by the boys?
- How many girls are there in all?
- How many children like chocolate flavour of ice cream?
- Find the ratio of children who like strawberry flavour to vanilla flavour of ice cream.
