Advertisements
Advertisements
प्रश्न
The bar graph given below represents the circulation of newspapers (dailies) in a town in six languages (the figures are approximated to hundreds).

Study the bar graph and answer the following questions:
- Find the total number of newspapers read in Hindi, Punjabi, Urdu, Marathi and Tamil.
- Find the excess number of newspapers read in Hindi than those in English.
- Name the language in which the least number of newspapers are read.
- Write the total circulation of newspapers in the town.
उत्तर
Number of newspapers in Urdu = 200
Number of newspapers in Tamil = 100
Number of newspapers in English = 500
Number of newspapers in Hindi = 800
Number of newspapers in Marathi = 300
Number of newspapers in Punjabi = 400
a. Total number of newspapers read in Hindi, Punjab, Urdu, Marathi and Tamil
= 800 + 400 + 200 + 300 + 100
= 1800
b. Excess number of newspapers read in Hindi than those in English
= Number of newspapers read in Hindi – Number of newspapers read in English
= 800 – 500
= 300
c. Out of all the newspapers, least number of newspapers in Tamil, i.e. 100 newspapers are read.
d. Total circulation of newspapers in the town.
= Number of newspapers in six different languages
= 200 + 100 + 500 + 800 + 300 + 400
= 2300
APPEARS IN
संबंधित प्रश्न
Practice time: Afterschool
Ask 10 of your friends about what they like to do most after school.
| What they like to do after school |
Number of children |
| Watching TV | |
| Playing football | |
| Reading storybooks | |
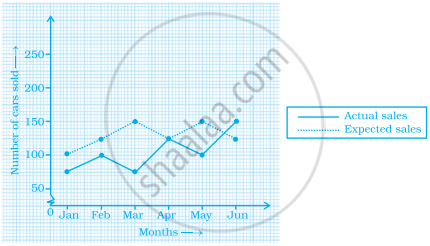
The graph given below gives the actual and expected sales of cars of a company for 6 months. Study the graph and answer the questions that follow.

- In which month was the actual sales same as the expected sales?
- For which month(s) was (were) the difference in actual and expected sales the maximum?
- For which month(s) was (were) the difference in actual and expected sales the least?
- What was the total sales of cars in the months–Jan, Feb. and March?
- What is the average sales of cars in the last three months?
- Find the ratio of sales in the first three months to the last three months
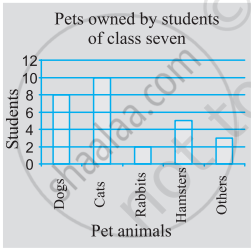
Use the bar graph (see the given figure) to answer the following question.

How many students have dog as a pet?
In a bar graph, the width of bars may be unequal.
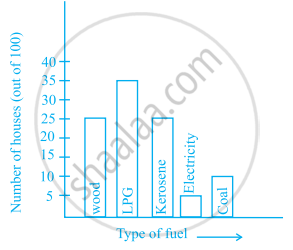
The following bar graph shows the number of houses (out of 100) in a town using different types of fuels for cooking.
Read the bar graph and answer the following questions:
Scale: 1 unit length = 5 houses
(a) Which fuel is used in maximum number of houses?
(b) How many houses are using coal as fuel?
(c) Suppose that the total number of houses in the town is 1 lakh.
From the above graph estimate the number of houses using electricity.
The following graph gives the information about the number of railway tickets sold for different cities on a railway ticket counter between 6.00 am to 10.00 am. Read the bar graph and answer the following questions.
Scale: 1 unit length = 10 tickets
(a) How many tickets were sold in all?
(b) For which city were the maximum number of tickets sold?
(c) For which city were the minimum number of tickets sold?
(d) Name the cities for which the number of tickets sold is more than 20
(e) Fill in the blanks: Number of tickets sold for Delhi and Jaipur together exceeds the total number of tickets sold for Patna and Chennai by ______.
The bar graph given below represents approximate length (in kilometres) of some National Highways in India. Study the bar graph and answer the following questions:
Scale: 1 unit length = 200 km
(a) Which National Highway (N.H.) is the longest among the above?
(b) Which National Highway is the shortest among the above?
(c) What is the length of National Highway 9?
(d) Length of which National Highway is about three times the National Highway10?
______ can be used to compare two collections of data.
Study the double bar graphs given below and answer the following questions:

- Which sport is liked the most by Class VIII students?
- How many students of Class VII like Hockey and Tennis in all?
- How many students are there in Class VII?
- For which sport is the number of students of Class VII less than that of Class VIII?
- For how many sports students of Class VIII are less than Class VII?
- Find the ratio of students who like Badminton in Class VII to students who like Tennis in Class VIII.
The table below gives the data of tourists visiting 5 hill stations over two consecutive years. Study the table and answer the questions that follow:
| Hill stations | Nainital | Shimla | Manali | Mussoorie | Kullu |
| 2008 | 4000 | 5200 | 3700 | 5800 | 3500 |
| 2009 | 4800 | 4500 | 4200 | 6200 | 4600 |
- Draw a double bar graph to depict the above information using appropriate scale.
- Which hill station was visited by the maximum number of tourists in 2008?
- Which hill station was visited by the least number of tourists in 2009?
- In which hill stations was there increase in number of tourists in the year 2009?
