Advertisements
Advertisements
प्रश्न
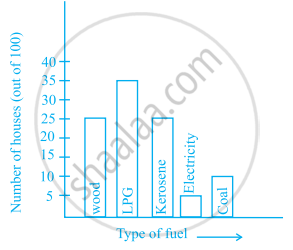
The following bar graph shows the number of houses (out of 100) in a town using different types of fuels for cooking.
Read the bar graph and answer the following questions:
Scale: 1 unit length = 5 houses
(a) Which fuel is used in maximum number of houses?
(b) How many houses are using coal as fuel?
(c) Suppose that the total number of houses in the town is 1 lakh.
From the above graph estimate the number of houses using electricity.
उत्तर
(a) LPG is used in maximum number of houses.
(b) 10 houses are using coal as fuel.
(c) Since, there are 5 houses using electricity out of 100. Therefore, out of 1 lakh the electricity will be used by `5/100 xx 100000` = 5000 houses.
APPEARS IN
संबंधित प्रश्न
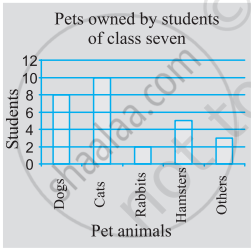
Use the bar graph (see the given figure) to answer the following question.

Which is the most popular pet?
The performance of students in 1st Term and 2nd Term is given. Draw a double bar graph choosing appropriate scale and answer the following:
| Subject | English | Hindi | Maths | Science | S. science |
| 1st Term (M.M. 100) | 67 | 72 | 88 | 81 | 73 |
| 2nd Term (M.M. 100) | 70 | 65 | 95 | 85 | 75 |
- In which subject, has the child improved his performance the most?
- In which subject is the improvement the least?
- Has the performance gone down in any subject?
The following table shows the number of Buses and Trucks in nearest lakh units. Draw percentage bar-diagram. (Approximate the percentages to the nearest integer)
| Year | No. of Trucks | No. of Buses |
| 2006-2007 | 47 | 9 |
| 2007-2008 | 56 | 13 |
| 2008-2009 | 60 | 16 |
| 2009-2010 | 63 | 18 |
In a bar graph, bars of ______ width can be drawn horizontally or vertically with ______ spacing between them.
______ can be used to compare two collections of data.
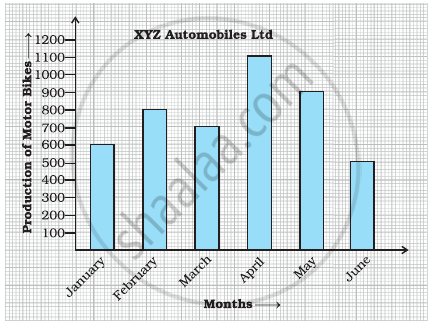
Observe the given bar graph carefully and answer the questions that follow.
- What information does the bar graph depict?
- How many motor bikes were produced in the first three months?
- Calculate the increase in production in May over the production in January.
- In which month the production was minimum and what was it?
- Calculate the average (mean) production of bikes in 6 months.
Study the bar graph given below and answer the questions that follow.

- What information does the above bar graph represent?
- In which year was production the least?
- After which year was the maximum rise in the production?
- Find the average production of rice during the 5 years.
- Find difference of rice production between years 2006 and 2008.
The bar graph given below represents the circulation of newspapers (dailies) in a town in six languages (the figures are approximated to hundreds).

Study the bar graph and answer the following questions:
- Find the total number of newspapers read in Hindi, Punjabi, Urdu, Marathi and Tamil.
- Find the excess number of newspapers read in Hindi than those in English.
- Name the language in which the least number of newspapers are read.
- Write the total circulation of newspapers in the town.
Study the double bar graph given below and answer the questions that follow:

- What information is compared in the above given double bar graph?
- Calculate the ratio of minimum temperatures in the year 2008 to the year 2009 for the month of November.
- For how many months was the minimum temperature in the year 2008 greater than that of year 2009? Name those months.
- Find the average minimum temperature for the year 2008 for the four months.
- In which month is the variation in the two temperatures maximum?
The table below gives the data of tourists visiting 5 hill stations over two consecutive years. Study the table and answer the questions that follow:
| Hill stations | Nainital | Shimla | Manali | Mussoorie | Kullu |
| 2008 | 4000 | 5200 | 3700 | 5800 | 3500 |
| 2009 | 4800 | 4500 | 4200 | 6200 | 4600 |
- Draw a double bar graph to depict the above information using appropriate scale.
- Which hill station was visited by the maximum number of tourists in 2008?
- Which hill station was visited by the least number of tourists in 2009?
- In which hill stations was there increase in number of tourists in the year 2009?
