Topics
Rational Numbers
- Rational Numbers
- Closure Property of Rational Numbers
- Commutative Property of Rational Numbers
- Associative Property of Rational Numbers
- Distributive Property of Multiplication Over Addition for Rational Numbers
- Identity of Addition and Multiplication of Rational Numbers
- Negative Or Additive Inverse of Rational Numbers
- Concept of Reciprocal or Multiplicative Inverse
- Rational Numbers on a Number Line
- Rational Numbers Between Two Rational Numbers
Linear Equations in One Variable
- Variable of Equation
- Concept of Equation
- Expressions with Variables
- Balancing an Equation
- The Solution of an Equation
- Linear Equation in One Variable
- Solving Equations Which Have Linear Expressions on One Side and Numbers on the Other Side
- Some Applications Solving Equations Which Have Linear Expressions on One Side and Numbers on the Other Side
- Solving Equations Having the Variable on Both Sides
- Some More Applications on the Basis of Solving Equations Having the Variable on Both Sides
- Reducing Equations to Simpler Form
- Equations Reducible to the Linear Form
Understanding Quadrilaterals
- Concept of Curves
- Different Types of Curves - Closed Curve, Open Curve, Simple Curve.
- Concept of Polygons
- Classification of Polygons
- Properties of a Quadrilateral
- Interior Angles of a Polygon
- Exterior Angles of a Polygon and Its Property
- Concept of Quadrilaterals
- Properties of Trapezium
- Properties of Kite
- Properties of a Parallelogram
- Properties of Rhombus
- Property: The Opposite Sides of a Parallelogram Are of Equal Length.
- Property: The Opposite Angles of a Parallelogram Are of Equal Measure.
- Property: The adjacent angles in a parallelogram are supplementary.
- Property: The diagonals of a parallelogram bisect each other. (at the point of their intersection)
- Property: The diagonals of a rhombus are perpendicular bisectors of one another.
- Property: The Diagonals of a Rectangle Are of Equal Length.
- Properties of Rectangle
- Properties of a Square
- Property: The diagonals of a square are perpendicular bisectors of each other.
Practical Geometry
- Introduction to Geometric Tool
- Constructing a Quadrilateral When the Lengths of Four Sides and a Diagonal Are Given
- Constructing a Quadrilateral When Two Diagonals and Three Sides Are Given
- Constructing a Quadrilateral When Two Adjacent Sides and Three Angles Are Known
- Constructing a Quadrilateral When Three Sides and Two Included Angles Are Given
- Some Special Cases
Data Handling
- Concept of Data Handling
- Interpretation of a Pictograph
- Interpretation of Bar Graphs
- Drawing a Bar Graph
- Interpretation of a Double Bar Graph
- Drawing a Double Bar Graph
- Organisation of Data
- Frequency Distribution Table
- Graphical Representation of Data as Histograms
- Concept of Pie Graph (Or a Circle-graph)
- Interpretation of Pie Diagram
- Chance and Probability - Chance
- Basic Ideas of Probability
Squares and Square Roots
- Concept of Square Number
- Properties of Square Numbers
- Some More Interesting Patterns of Square Number
- Finding the Square of a Number
- Concept of Square Roots
- Finding Square Root Through Repeated Subtraction
- Finding Square Root Through Prime Factorisation
- Finding Square Root by Division Method
- Square Root of Decimal Numbers
- Estimating Square Root
Cubes and Cube Roots
Comparing Quantities
- Concept of Ratio
- Basic Concept of Percentage
- Increase Or Decrease as Percent
- Concept of Discount
- Estimation in Percentages
- Basic Concepts of Profit and Loss
- Sales Tax, Value Added Tax, and Good and Services Tax
- Calculation of Interest
- Concept of Compound Interest
- Deducing a Formula for Compound Interest
- Rate Compounded Annually Or Half Yearly (Semi Annually)
- Applications of Compound Interest Formula
Algebraic Expressions and Identities
- Algebraic Expressions
- Terms, Factors and Coefficients of Expression
- Types of Algebraic Expressions as Monomials, Binomials, Trinomials, and Polynomials
- Like and Unlike Terms
- Addition of Algebraic Expressions
- Subtraction of Algebraic Expressions
- Multiplication of Algebraic Expressions
- Multiplying Monomial by Monomials
- Multiplying a Monomial by a Binomial
- Multiplying a Monomial by a Trinomial
- Multiplying a Binomial by a Binomial
- Multiplying a Binomial by a Trinomial
- Concept of Identity
- Expansion of (a + b)2 = a2 + 2ab + b2
- Expansion of (a - b)2 = a2 - 2ab + b2
- Expansion of (a + b)(a - b) = a2-b2
- Expansion of (x + a)(x + b)
Mensuration
Visualizing Solid Shapes
Exponents and Powers
Direct and Inverse Proportions
Factorization
- Factors and Multiples
- Factorising Algebraic Expressions
- Factorisation by Taking Out Common Factors
- Factorisation by Regrouping Terms
- Factorisation Using Identities
- Factors of the Form (x + a)(x + b)
- Dividing a Monomial by a Monomial
- Dividing a Polynomial by a Monomial
- Dividing a Polynomial by a Polynomial
- Concept of Find the Error
Introduction to Graphs
- Concept of Bar Graph
- Interpretation of Bar Graphs
- Drawing a Bar Graph
- Concept of Double Bar Graph
- Interpretation of a Double Bar Graph
- Drawing a Double Bar Graph
- Concept of Pie Graph (Or a Circle-graph)
- Graphical Representation of Data as Histograms
- Concept of a Line Graph
- Linear Graphs
- Some Application of Linear Graphs
Playing with Numbers
- Independent variable
- Dependent variable
- Quantity and Cost
- Principal and Simple Interest
- Time and Distance
Definition
-
Independent Variable: Anything which is completely independent and its quantity do not depend on any other factor then it is called Independent Variable.
-
Dependent Variable: Anything which increases or decreases with the quantity of any other factor or it is dependent on any other factor then it is called Dependent Variable.
Notes
Some Applications:
-
Independent Variable: Anything which is completely independent and its quantity do not depend on any other factor then it is called Independent Variable.
-
Dependent Variable: Anything which increases or decreases with the quantity of any other factor or it is dependent on any other factor then it is called a Dependent Variable.
-
For example, If more electricity is consumed, the bill is bound to be high. The amount of electric bill depends on the quantity of electricity used. We say that the quantity of electricity is an independent variable (or sometimes control variable) and the amount of electric bill is the dependent variable.
-
The relation between the dependent variable and the independent variable is shown through a graph.
For example,
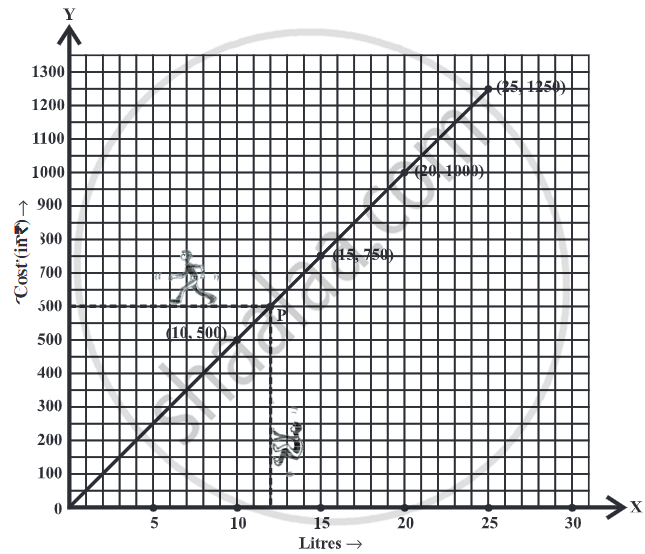
The following table gives the quantity of petrol and its cost.
| No. of Litres of petrol | 10 | 15 | 20 | 25 |
| Cost of petrol in ₹ | 500 | 750 | 1000 | 1250 |
Plot a graph to show the data.
Solution:
- Let us take a suitable scale on both the axes.
- Mark the number of litres along the horizontal axis.
- Mark cost of petrol along the vertical axis.
- Plot the points: (10,500), (15,750), (20,1000), (25,1250).
- Join the points.
Example
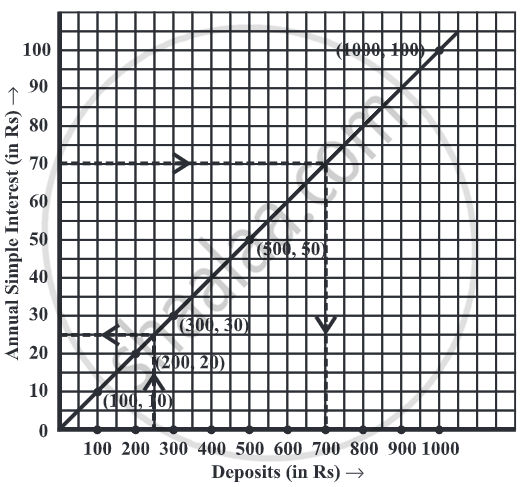
| Sum deposited | Simple interest for a year |
| ₹ 100 | ₹ `(100 xx 1 xx 10)/100` = ₹ 10 |
| ₹ 200 | ₹ `(200 xx 1 xx 10)/100` = ₹ 20 |
| ₹ 300 | ₹ `(300 xx 1 xx 10)/100` = ₹ 30 |
| ₹ 500 | ₹ `(500 xx 1 xx 10)/100` = ₹ 50 |
| ₹ 1000 | ₹ 100 |
| Deposit (in ₹) | 100 | 200 | 300 | 500 | 1000 |
| Annual S.I. (in ₹) | 10 | 20 | 30 | 50 | 100 |
- Corresponding to ₹ 250 on the horizontal axis, we get the interest to be ₹ 25 on the vertical axis.
- Corresponding to ₹ 70 on the vertical axis, we get the sum to be ₹ 700 on the horizontal axis.
Example
| Hours of ride | Distance covered |
| 1 hour | 30 km |
| 2 hours | 2 × 30 km = 60 km |
| 3 hours | 3 × 30 km = 90 km |
| 4 hours | 4 × 30 km = 120 km and so on. |
| Time (in hours) | 1 | 2 | 3 | 4 |
| Distance covered (in km) | 30 | 60 | 90 | 120 |
Horizontal: 2

Shaalaa.com | Some Application of Linear Graphs
Series: Some Application of Linear Graphs
Related QuestionsVIEW ALL [8]
Draw a graph for the following:
| Side of square (in cm) | 2 | 3 | 4 | 5 | 6 |
| Area (in cm2) | 4 | 9 | 16 | 25 | 36 |
Is it a linear graph?
Draw the graphs for the following tables of values, with suitable scales on the axes.
Interest on deposits for a year:
| Deposit (in Rs) | 1000 | 2000 | 3000 | 4000 | 5000 |
| Simple interest (in Rs) | 80 | 160 | 240 | 320 | 400 |
- Does the graph pass through the origin?
- Use the graph to find the interest on Rs 2500 for a year:
- To get an interest of Rs 280 per year, how much money should be deposited?
Draw a graph for the following:
| Side of square (in cm) | 2 | 3 | 3.5 | 5 | 6 |
| Perimeter (in cm) | 8 | 12 | 14 | 20 | 24 |
Is it a linear graph?
Draw the graphs for the following tables of values, with suitable scales on the axes.
Cost of apples
| Number of apples | 1 | 2 | 3 | 4 | 5 |
| Cost (in ₹) | 5 | 10 | 15 | 20 | 25 |
Draw the graphs for the following tables of values, with suitable scales on the axes.
Distance travelled by a car
| Time (in hours) | 6 a.m. | 7 a.m. | 8 a.m. | 9 a.m. |
| Distance (in km) | 40 | 80 | 120 | 160 |
- How much distance did the car cover during the period 7.30 a.m. to 8 a.m.?
- What was the time when the car had covered a distance of 100 km since it's start?
