Topics
Linear equations in two variables
- Introduction to linear equations in two variables
- Methods of solving linear equations in two variables
- Simultaneous method
- Simultaneous method
- Substitution Method
- Cross - Multiplication Method
- Graphical Method
- Determinant method
- Determinant of Order Two
- Equations Reducible to a Pair of Linear Equations in Two Variables
- Simple Situational Problems
- Pair of Linear Equations in Two Variables
- Application of simultaneous equations
- Simultaneous method
Quadratic Equations
- Quadratic Equations
- Roots of a Quadratic Equation
- Solutions of Quadratic Equations by Factorization
- Solutions of Quadratic Equations by Completing the Square
- Formula for Solving a Quadratic Equation
- Nature of Roots of a Quadratic Equation
- The Relation Between Roots of the Quadratic Equation and Coefficients
- To Obtain a Quadratic Equation Having Given Roots
- Application of Quadratic Equation
Arithmetic Progression
- Introduction to Sequence
- Terms in a sequence
- Arithmetic Progression
- General Term of an Arithmetic Progression
- Sum of First ‘n’ Terms of an Arithmetic Progressions
- Arithmetic Progressions Examples and Solutions
- Geometric Progression
- General Term of an Geomatric Progression
- Sum of the First 'N' Terms of an Geometric Progression
- Geometric Mean
- Arithmetic Mean - Raw Data
- Concept of Ratio
Financial Planning
Probability
- Probability - A Theoretical Approach
- Basic Ideas of Probability
- Random Experiments
- Outcome
- Equally Likely Outcomes
- Sample Space
- Event and Its Types
- Probability of an Event
- Type of Event - Elementry
- Type of Event - Complementry
- Type of Event - Exclusive
- Type of Event - Exhaustive
- Concept Or Properties of Probability
- Addition Theorem
Statistics
- Tabulation of Data
- Inclusive and Exclusive Type of Tables
- Ogives (Cumulative Frequency Graphs)
- Applications of Ogives in Determination of Median
- Relation Between Measures of Central Tendency
- Introduction to Normal Distribution
- Properties of Normal Distribution
- Concepts of Statistics
- Mean of Grouped Data
- Method of Finding Mean for Grouped Data: Direct Method
- Method of Finding Mean for Grouped Data: Deviation Or Assumed Mean Method
- Method of Finding Mean for Grouped Data: the Step Deviation Method
- Median of Grouped Data
- Mode of Grouped Data
- Concept of Pictograph
- Presentation of Data
- Graphical Representation of Data as Histograms
- Frequency Polygon
- Concept of Pie Graph (Or a Circle-graph)
- Interpretation of Pie Diagram
- Drawing a Pie Graph
Notes
Interpretation of Pie Diagram:
Interpretation of a pie diagram means the action of explaining the meaning of pie diagram.
1) The following pie chart, gives the expenditure (in percentage) on various items and savings of a family during a month.
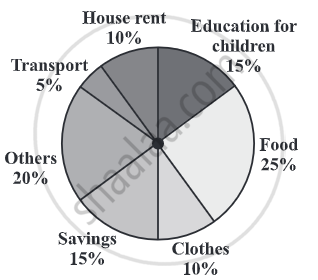
(i) On which item, the expenditure was maximum?
(ii) Expenditure on which item is equal to the total savings of the family?
(iii) If the monthly savings of the family is Rs. 3000, what is the monthly expenditure on clothes?
Solution:
(i) Expenditure is maximum on food.
(ii) Expenditure on Education of children is the same (i.e., 15%) as the savings of the family.
(iii) 15% represents Rs. 3000.
Therefore, 10% represents Rs. `3000/15 xx 10 = Rs. 2000`.
If you would like to contribute notes or other learning material, please submit them using the button below.
Related QuestionsVIEW ALL [20]
Monthly expenditure of Kumaran’s family is given below. Draw a suitable Pie chart.
| Particulars | Food | Education | Rent | Transport | Miscellaneous |
| Expenses (in %) | 50% | 20% | 15% | 5% | 10% |
Also
1. Find the amount spent for education if Kumaran spends ₹ 6000 for Rent.
2. What is the total salary of Kumaran?
3. How much did he spend more for food than education?
In the pie-diagram, the data of 720 students who opted for their favourite literature type is shown. The data is expressed in the percentages. Using this diagram complete the following table.
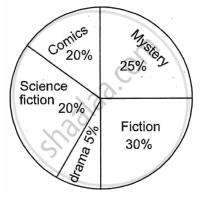
| Type of Literature | Angular measure | Number of students |
| Comics | 72° | 144 |
| Mystery | 90° | ______ |
| Fiction | ______ | 216 |
| Drama | ______ | ______ |
| Science Fiction | 72° | 144 |

The following table shows the percentage of demand of different plants.
| Plants | Rose | Lily | Tulip | Daisy | Dahlia |
| No. of Plants | 31 | 25 | 12 | 17 | 15 |
Complete the following table:
| Plants | No. of plants | Measure of central angle |
| Rose | 31 | `31/100 xx 360^circ = square` |
| Lily | 25 | `square` |
| Tulip | 12 | `square` |
| Daisy | 17 | `square` |
| Dahlia | 15 | `square` |
