Topics
Linear equations in two variables
- Introduction to linear equations in two variables
- Methods of solving linear equations in two variables
- Simultaneous method
- Simultaneous method
- Substitution Method
- Cross - Multiplication Method
- Graphical Method
- Determinant method
- Determinant of Order Two
- Equations Reducible to a Pair of Linear Equations in Two Variables
- Simple Situational Problems
- Pair of Linear Equations in Two Variables
- Application of simultaneous equations
- Simultaneous method
Quadratic Equations
- Quadratic Equations
- Roots of a Quadratic Equation
- Solutions of Quadratic Equations by Factorization
- Solutions of Quadratic Equations by Completing the Square
- Formula for Solving a Quadratic Equation
- Nature of Roots of a Quadratic Equation
- The Relation Between Roots of the Quadratic Equation and Coefficients
- To Obtain a Quadratic Equation Having Given Roots
- Application of Quadratic Equation
Arithmetic Progression
- Introduction to Sequence
- Terms in a sequence
- Arithmetic Progression
- General Term of an Arithmetic Progression
- Sum of First ‘n’ Terms of an Arithmetic Progressions
- Arithmetic Progressions Examples and Solutions
- Geometric Progression
- General Term of an Geomatric Progression
- Sum of the First 'N' Terms of an Geometric Progression
- Geometric Mean
- Arithmetic Mean - Raw Data
- Concept of Ratio
Financial Planning
Probability
- Probability - A Theoretical Approach
- Basic Ideas of Probability
- Random Experiments
- Outcome
- Equally Likely Outcomes
- Sample Space
- Event and Its Types
- Probability of an Event
- Type of Event - Elementry
- Type of Event - Complementry
- Type of Event - Exclusive
- Type of Event - Exhaustive
- Concept Or Properties of Probability
- Addition Theorem
Statistics
- Tabulation of Data
- Inclusive and Exclusive Type of Tables
- Ogives (Cumulative Frequency Graphs)
- Applications of Ogives in Determination of Median
- Relation Between Measures of Central Tendency
- Introduction to Normal Distribution
- Properties of Normal Distribution
- Concepts of Statistics
- Mean of Grouped Data
- Method of Finding Mean for Grouped Data: Direct Method
- Method of Finding Mean for Grouped Data: Deviation Or Assumed Mean Method
- Method of Finding Mean for Grouped Data: the Step Deviation Method
- Median of Grouped Data
- Mode of Grouped Data
- Concept of Pictograph
- Presentation of Data
- Graphical Representation of Data as Histograms
- Frequency Polygon
- Concept of Pie Graph (Or a Circle-graph)
- Interpretation of Pie Diagram
- Drawing a Pie Graph
Concept of Pictograph
A pictograph is the representation of data using pictures. Pictographs represent the frequency of data using symbols or images that are relevant to the data.
This is one of the simplest ways to represent data.
- Pictographs were used as the earliest known form of writing, with examples having been discovered in Egypt and Mesopotamia since 3000 BC.
- A pictograph is also called a Pictogram.
- The data can be easily analysed and interpreted.
For example:
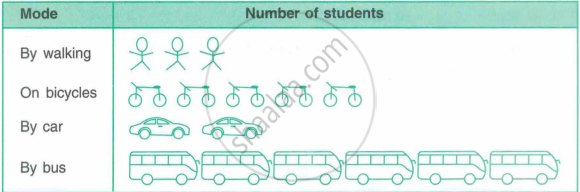
The modes of travelling to school by 160 students are given below:
| Mode | By walking | On bicycle | By car | By bus |
| No. of students | 30 | 50 | 20 | 60 |
Draw a suitable pictograph.
Solution :
Since every given number of data is completely divisible by 10, therefore the scale will be:
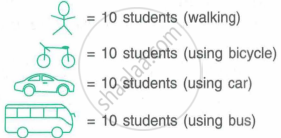
The required pictograph will be as shown below :
Shaalaa.com | What Is Pictograph
Related QuestionsVIEW ALL [30]
The following pictograph shows the number of cars sold by four dealers A, B, C and D in a city. Scale:  = 50 cars.
| Dealer | Number of cars |
| A |       |
| B |      |
| C |         |
| D |     |
Using the pictograph, drawn above, answer the following questions:
What is the total number of cars sold by all the dealers?
The number of scouts in a school is depicted by the following pictograph:
| Class | Number of scouts |
| VI |  |
| VII |  |
| VIII |  |
| IX |  |
| X |  |
Observe the pictograph and answer the following questions:
(a) Which class has the minimum number of scouts?
(b) Which class has the maximum number of scouts?
(c) How many scouts are there in Class VI?
(d) Which class has exactly four times the scouts as that of Class X?
(e) What is the total number of scouts in the Classes VI to X?
The following table shows the area of the land on which different crops were grown.
| Crop | Area of land (in million hectares) |
| Rice | 50 |
| Wheat | 30 |
| Pulses | 20 |
| Sugarcane | 25 |
| Cotton | 15 |
Prepare a pictograph by choosing a suitable symbol to represent 10 million hectares.
Annual expenditure of a company in the year 2007-2008 is given below:
| Items | Expenditure (Rs in lakh) |
| Salaries of employees | 65 |
| Advertisement | 10 |
| Purchase of machiner | 85 |
| Electricity and water | 15 |
| Transportation | 25 |
| Other expenses | 30 |
Prepare a pictograph of the above data using an appropriate symbol to represent Rs 10 lakh.
The following table gives information about the circulation of newspapers (dailies) in a town in five languages.
| Language | English | Hindi | Tamil | Punjabi | Gujarati |
| Number of newspapers |
5000 | 8500 | 500 | 2500 | 1000 |
Prepare a pictograph of the above data, using a symbol of your choice, each representing 1000 newspapers.
The number of animals in five villages are as follows:
| Village | A | B | C | D | E |
| No. of. animals | 160 | 240 | 180 | 80 | 120 |
Prepare a pictograph of these animals using one symbol to represent 20 animals.
