Advertisements
Advertisements
प्रश्न
In a bar graph, ______ can be drawn horizontally or vertically.
उत्तर
In a bar graph, bars can be drawn horizontally or vertically.
APPEARS IN
संबंधित प्रश्न
The following table shows the number of Buses and Trucks in nearest lakh units. Draw percentage bar-diagram. (Approximate the percentages to the nearest integer)
| Year | No of trucks | No of buses |
| 2005-2006 2007-2008 2008-2009 2009-2010 |
47 56 60 63 |
9 13 16 18 |
In the table given below, the information is given about roads. Using this draw a sub-divided and percentage bar diagram (Approximate the percentages to the nearest integer).
| Year | Permanent Roads ( Lakh km.) |
Temporary Roads ( Lakh km.) |
| 2000-2001 | 14 | 10 |
| 2001-2002 | 15 | 11 |
| 2002-2003 | 17 | 13 |
| 2003-2004 | 20 | 19 |
The following table shows the number of Buses and Trucks in nearest lakh units. Draw percentage bar-diagram. (Approximate the percentages to the nearest integer)
| Year | No. of Trucks | No. of Buses |
| 2005-2006 | 47 | 9 |
| 2007-2008 | 56 | 13 |
| 2008-2009 | 60 | 16 |
| 2009-2010 | 63 | 18 |
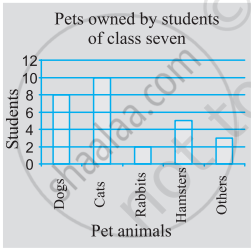
Use the bar graph (see the given figure) to answer the following question.

How many students have dog as a pet?
In a bar graph, the gap between two consecutive bars may not be the same.
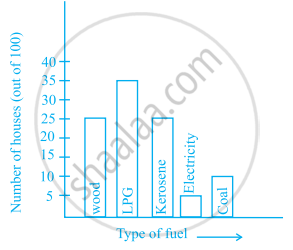
The following bar graph shows the number of houses (out of 100) in a town using different types of fuels for cooking.
Read the bar graph and answer the following questions:
Scale: 1 unit length = 5 houses
(a) Which fuel is used in maximum number of houses?
(b) How many houses are using coal as fuel?
(c) Suppose that the total number of houses in the town is 1 lakh.
From the above graph estimate the number of houses using electricity.
| Crop | Area of land (in million hectares) |
| Rice | 50 |
| Wheat | 30 |
| Pulses | 20 |
| Sugarcane | 25 |
| Cotton | 15 |
Prepare a bar graph of the data.
The representation of data with bars of uniform width is called ______.
In a public library, the following observations were recorded by the librarian in a particular week:
| Days | Mon | Tues | Wed | Thurs | Fri | Sat |
| Newspaper Readers |
400 | 600 | 350 | 550 | 500 | 350 |
| Magazines Readers |
150 | 100 | 200 | 300 | 250 | 200 |
- Draw a double bar graph choosing an appropriate scale.
- On which day, the number of readers in the library was maximum?
- What is the mean number of magazine readers?
The table below gives the data of tourists visiting 5 hill stations over two consecutive years. Study the table and answer the questions that follow:
| Hill stations | Nainital | Shimla | Manali | Mussoorie | Kullu |
| 2008 | 4000 | 5200 | 3700 | 5800 | 3500 |
| 2009 | 4800 | 4500 | 4200 | 6200 | 4600 |
- Draw a double bar graph to depict the above information using appropriate scale.
- Which hill station was visited by the maximum number of tourists in 2008?
- Which hill station was visited by the least number of tourists in 2009?
- In which hill stations was there increase in number of tourists in the year 2009?
