Advertisements
Advertisements
प्रश्न
In a bar graph, the width of bars may be unequal.
पर्याय
True
False
उत्तर
This statement is False.
Explanation:
Since, a bar graph is a pictorial representation of the numerical data by a number of bars of uniform width erected horizontally or vertically with equal spacing between them.
APPEARS IN
संबंधित प्रश्न
Read the bar graph (see the given figure) which shows the number of books sold by a bookstore during five consecutive years and answer the questions that follow:
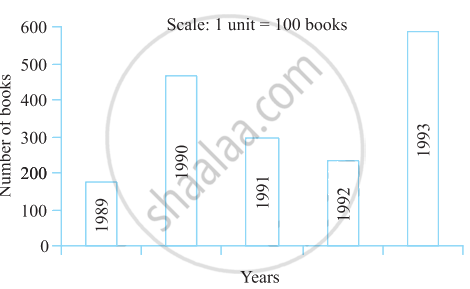
- About how many books were sold in 1989? 1990? 1992?
- In which year were about 475 books sold? About 225 books sold?
- In which years were fewer than 250 books sold?
- Can you explain how you would estimate the number of books sold in 1989?
The graph given below gives the actual and expected sales of cars of a company for 6 months. Study the graph and answer the questions that follow.
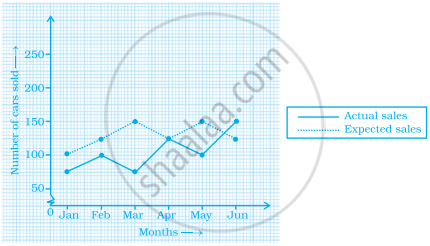
- In which month was the actual sales same as the expected sales?
- For which month(s) was (were) the difference in actual and expected sales the maximum?
- For which month(s) was (were) the difference in actual and expected sales the least?
- What was the total sales of cars in the months–Jan, Feb. and March?
- What is the average sales of cars in the last three months?
- Find the ratio of sales in the first three months to the last three months
In a bar graph, bars of uniform width are drawn vertically only.
In a bar graph, the gap between two consecutive bars may not be the same.
Prepare a bar graph of the data given in
| Surname | Number of people |
| Khan |  |
| Patel |  |
| Rao |  |
| Roy |  |
| Saikia |  |
| Singh |  |
The bar graph given below shows the marks of students of a class in a particular subject:

Study the bar graph and answer the following questions:
- If 40 is the pass mark, then how many students have failed?
- How many students got marks from 50 to 69?
- How many students scored 90 marks and above?
- If students who scored marks above 80 are given merits then how many merit holders are there?
- What is the strength of the class?
Study the bar graph given below and answer the questions that follow:

- What information is depicted from the bar graph?
- In which subject is the student very good?
- Calculate the average marks of the student.
- If 75 and above marks denote a distinction, then name the subjects in which the student got distinction.
- Calculate the percentage of marks the student got out of 500.
The bar graph given below represents the circulation of newspapers (dailies) in a town in six languages (the figures are approximated to hundreds).

Study the bar graph and answer the following questions:
- Find the total number of newspapers read in Hindi, Punjabi, Urdu, Marathi and Tamil.
- Find the excess number of newspapers read in Hindi than those in English.
- Name the language in which the least number of newspapers are read.
- Write the total circulation of newspapers in the town.
The table below compares the population (in hundreds) of 4 towns over two years:
| Towns | A | B | C | D |
| 2007 | 2900 | 6400 | 8300 | 4600 |
| 2009 | 3200 | 7500 | 9200 | 6300 |
Study the table and answer the following questions:
- Draw a double bar graph using appropriate scale to depict the above information.
- In which town was the population growth maximum?
- In which town was the population growth least?
The table below gives the flavours of ice cream liked by children (boys and girls) of a society.
| Flavours | Vanilla | Chocolate | Strawberry | Mango | Butterscotch |
| Boys | 4 | 9 | 3 | 8 | 13 |
| Girls | 8 | 12 | 7 | 9 | 10 |
Study the table and answer the following questions:
- Draw a double bar graph using appropriate scale to represent the above information.
- Which flavour is liked the most by the boys?
- How many girls are there in all?
- How many children like chocolate flavour of ice cream?
- Find the ratio of children who like strawberry flavour to vanilla flavour of ice cream.
