Advertisements
Advertisements
प्रश्न
In a bar graph, the gap between two consecutive bars may not be the same.
पर्याय
True
False
उत्तर
This statement is False.
Explanation:
In a bar graph, the gap between two consecutive bars must be equal.
APPEARS IN
संबंधित प्रश्न
Plot the points (2, 8), (7, 8) and (12, 8). Join these points in pairs. Do they lie on a line? What do you observe?
Practice time: Afterschool
Ask 10 of your friends about what they like to do most after school.
| What they like to do after school |
Number of children |
| Watching TV | |
| Playing football | |
| Reading storybooks | |
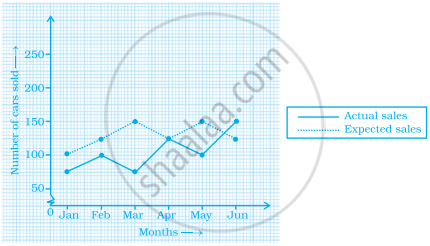
The graph given below gives the actual and expected sales of cars of a company for 6 months. Study the graph and answer the questions that follow.

- In which month was the actual sales same as the expected sales?
- For which month(s) was (were) the difference in actual and expected sales the maximum?
- For which month(s) was (were) the difference in actual and expected sales the least?
- What was the total sales of cars in the months–Jan, Feb. and March?
- What is the average sales of cars in the last three months?
- Find the ratio of sales in the first three months to the last three months
To represent the population of different towns using bar graph, it is convenient to take one unit length to represent one person.
In a bar graph, ______ can be drawn horizontally or vertically.
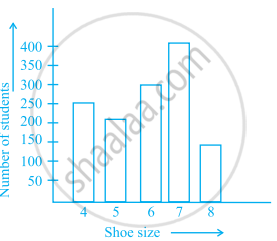
The following bar graph represents the data for different sizes of shoes worn by the students in a school. Read the graph and answer the following questions.
Scale: 1 unit length = 50 students
(a) Find the number of students whose shoe sizes have been collected.
(b) What is the number of students wearing shoe size 6?
(c) What are the different sizes of the shoes worn by the students?
(d) Which shoe size is worn by the maximum number of students?
(e) Which shoe size is worn by minimum number of students?
(f) State whether true or false:
The total number of students wearing shoe sizes 5 and 8 is the same as the number of students wearing shoe size 6.
Number of mobile phone users in various age groups in a city is listed below:
| Age group (in years) | Number of mobile users |
| 1 – 20 | 25000 |
| 21 – 40 | 40000 |
| 41 – 50 | 35000 |
| 61 – 80 | 10000 |
Draw a bar graph to represent the above information.
Scale: 1 unit length = 200 km
Prepare a pictograph of the data by taking a suitable symbol to represent 200 kilometers.
| Crop | Area of land (in million hectares) |
| Rice | 50 |
| Wheat | 30 |
| Pulses | 20 |
| Sugarcane | 25 |
| Cotton | 15 |
Prepare a bar graph of the data.
The table below gives the flavours of ice cream liked by children (boys and girls) of a society.
| Flavours | Vanilla | Chocolate | Strawberry | Mango | Butterscotch |
| Boys | 4 | 9 | 3 | 8 | 13 |
| Girls | 8 | 12 | 7 | 9 | 10 |
Study the table and answer the following questions:
- Draw a double bar graph using appropriate scale to represent the above information.
- Which flavour is liked the most by the boys?
- How many girls are there in all?
- How many children like chocolate flavour of ice cream?
- Find the ratio of children who like strawberry flavour to vanilla flavour of ice cream.
