Advertisements
Advertisements
प्रश्न
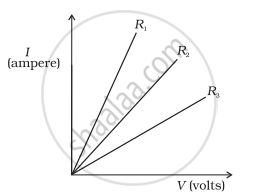
A student carries out an experiment and plots the V-I graph of three samples of nichrome wire with resistances R1, R2 and R3 respectively. Which of the following is true?
पर्याय
R1 = R2 = R3
R1 > R2 > R3
R3 > R2 > R1
R2 > R3 > R1
उत्तर
R3 > R2 > R1
Explanation -
Since the current (I) is plotted on y-axis and potential difference (V) is plotted on x-axis, so the slope of the graph is `1/"R"`. It means higher the slope, the lesser is the resistance. So, R1 will be minimum and R3 will be maximum.
APPEARS IN
संबंधित प्रश्न
Find the resistance of a conductor if 0.24 A current is passing through it and a potential difference of 24 V is applied across it.
Let the resistance of an electrical component remains constant while the potential difference across the two ends of the component decreases to half of its former value. What change will occur in the current through it?
Find the expression for the resistivity of a material and state the SI unit of resistivity.
Name the physical quantity whose unit is "ohm".
Fill in the following blank with suitable words:
Resistance is measured in .............. The resistance of a wire increases as the length ..............; as the temperature ..............; and as the cross-sectional area .............. .
The resistance of a nichrome wire at 0°C is 10Ω. If its temperature coefficient of resistivity of nichrome is 0.004/ °C, find its resistance of the wire at boiling point of water. Comment on the result.
An electronics hobbyist is building a radio which requires 150 Ω in her circuit, but she has only 220 Ω, 79 Ω, and 92 Ω resistors available. How can she connect the available resistors to get the desired value of resistance?
A heater of 220 V heats a volume of water m 5 mint time. A heater of 110 V heat in ten second. The resistance of the conductor is
Ohm's law deals with the relationship between ______
A current of 0.8 A flows in a conductor of 40 Ω for 1 minute. The heat produced in the conductor will be ______.
