Advertisements
Advertisements
Question
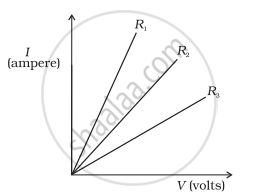
A student carries out an experiment and plots the V-I graph of three samples of nichrome wire with resistances R1, R2 and R3 respectively. Which of the following is true?
Options
R1 = R2 = R3
R1 > R2 > R3
R3 > R2 > R1
R2 > R3 > R1
Solution
R3 > R2 > R1
Explanation -
Since the current (I) is plotted on y-axis and potential difference (V) is plotted on x-axis, so the slope of the graph is `1/"R"`. It means higher the slope, the lesser is the resistance. So, R1 will be minimum and R3 will be maximum.
APPEARS IN
RELATED QUESTIONS
When a 12 V battery is connected across an unknown resistor, there is a current of 2.5 mA in the circuit. Find the value of the resistance of the resistor.
What is Resistivity?
Name the unit of electrical resistance and give its symbol.
What is an ohmic resistor? Give one example of an ohmic resistor. Draw a graph to show its current voltage relationship. How is the resistance of the resistor determined from this graph?
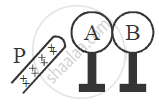
Two metallic spheres A and B kept on insulating stands are in contact with each other. A positively charged rod P is brought near the sphere A as shown in the figure. The two spheres are separated from each other, and the rod P is removed. What will be the nature of charges on spheres A and B?
Define the following:
(i) Coulomb
(ii) Ohm
What is meant by the drift speed of free electrons?
Explain the equivalent resistance of a parallel resistor network.
Two cells each of 5V are connected in series across an 8Ω resistor and three parallel resistors of 4Ω, 6Ω, and 12Ω. Draw a circuit diagram for the above arrangement. Calculate
- the current drawn from the cell
- current through each resistor
Suppose there is a circuit consisting of only resistances and batteries and we have to double (or increase it to n-times) all voltages and all resistances. Show that currents are unaltered. Do this for circuit of Example 3.7 in the NCERT Text Book for Class XII.
