Advertisements
Advertisements
प्रश्न
Briefly explain any three determinants for the negative slope of the demand curve.
Why does the demand curve slope downwards from left to right?
Explain briefly the causes of operation of the Law of demand.
उत्तर
Reasons for the Downward sloping Demand curve
- The law of diminishing marginal utility: The law states that with consumption of an additional unit of a commodity, marginal utility derived from successive units goes on declining. A consumer. will buy more and more units of commodity only when he has to pay less and less price for each additional unit.
- Income Effect: When price of commodity falls, consumers real income or purchasing power increases. This induces them to buy more of that commodity, thus demand increases and vice-versa.
- Change in number of buyers: When the price of a commodity falls, some new consumers start purchasing it, consequently the demand for that commodity increases. On the other hand, when the price rises, existing consumers may stop purchasing the commodity, thus the demand for that commodity will fall.
APPEARS IN
संबंधित प्रश्न
The demand curve is generally ______.
The market demand curve is a ______ summation of all Individual demand curves:
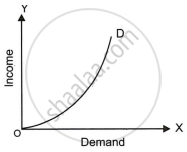
What does the graph below indicate?
Assertion (A): If the income of a consumer increases, other things constant, the demand curve for a normal goods shifts to the right.
Reason (R): As income increases, the demand curve for an inferior good shifts to the left.
Assertion (A): Demand curve is downward sloping.
Reason (R): Demand curve slopes downwards from left to the right because price and quantity demanded are inversely related.
What does the demand curve given below show?
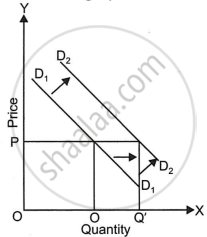
Give two reasons for the shift of the demand curve towards the right.
Draw a demand curve on the basis of the following data.
| Price per unit (₹) | 2 | 3 | 4 | 5 | 6 | 7 |
| Quantity demanded (Units) | 1000 | 800 | 700 | 600 | 500 | 200 |
Does a demand curve always have a negative slope? Give three reasons to justify your answer.
With the help of a diagram, show how a market demand curve can be obtained from individual demand curves.
