Advertisements
Advertisements
प्रश्न
Can displacement-time sketch be parallel to the displacement axis? Give a reason to your answer.
उत्तर
The displacement-time graph can never be parallel to the displacement axis because such a line would mean that the distance covered by the body in a certain direction increases without any increase in time, which is not possible.
APPEARS IN
संबंधित प्रश्न
Complete a sentence and explain it.
The minimum distance between the start and finish points of the motion of an object is called the ______ of the object.
Figure given below shows a velocity-time graph for a car starting from rest. The graph has three parts AB, BC and CD.

State how is the distance travelled in any part determined from this graph .
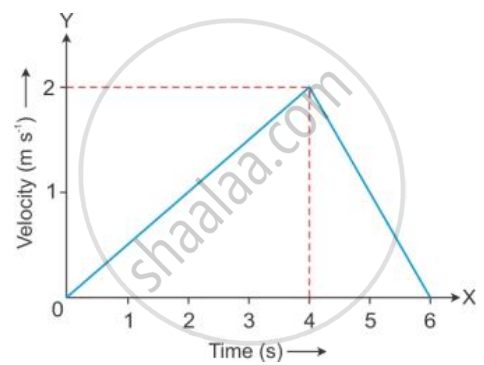
Figure shows the velocity-time graph of a particle moving in a straight line.

(i) State the nature of motion of particle.
(ii) Find the displacement of particle at t = 6 s.
(iii) Does the particle change its direction of motion?
(iv) Compare the distance travelled by the particle from 0 to 4 s and from 4 s to 6 s.
(v) Find the acceleration from 0 to 4 s and retardation from 4 s to 6 s.
Write an expression for the distance S covered in time t by a body which is initially at rest and starts moving with a constant acceleration a.
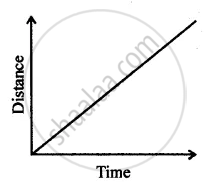
Can you suggest the kind of motion of a body from the following distance – time graph?

A particle moves along a circular path. How many times does it change its direction in two complete rounds?
A particle is moving in a circular path of radius r. The displacement after half a circle would be
Assertion: Displacement of a body may be zero when distance travelled by it is not zero.
Reason: The displacement is the shortest distance between initial and final position.
The displacement of a moving object in a given interval of time is zero. Would the distance travelled by the object also be zero? Justify your answer.
Using the following data, draw time - displacement graph for a moving object:
| Time (s) | 0 | 2 | 4 | 6 | 8 | 10 | 12 | 14 | 16 |
| Displacement (m) | 0 | 2 | 4 | 4 | 4 | 6 | 4 | 2 | 0 |
Use this graph to find average velocity for the first 4 s, for the next 4 s and for the last 6 s.
