Advertisements
Advertisements
प्रश्न
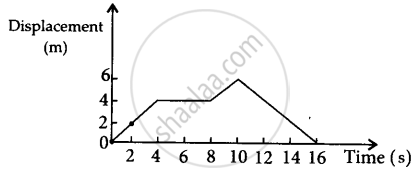
Using the following data, draw time - displacement graph for a moving object:
| Time (s) | 0 | 2 | 4 | 6 | 8 | 10 | 12 | 14 | 16 |
| Displacement (m) | 0 | 2 | 4 | 4 | 4 | 6 | 4 | 2 | 0 |
Use this graph to find average velocity for the first 4 s, for the next 4 s and for the last 6 s.
उत्तर
From the given data, the displacement-time graph is shown as

Average velocity = `("Change in displacement")/("time interval")`
∴ For first 4s, v1 = `(4 - 0)/4`
= 1 ms−1
For next 4s v2 = `(4 - 4)/4`
= 0 ms−1
For last 6s v3 = `(0 - 6)/6`
= −1 ms−1
APPEARS IN
संबंधित प्रश्न
State whether distance is a scalar or a vector quantity.
The numerical ratio of displacement to distance for a moving object is :
Copy the following table and fill in the blank spaces.
| Quantity | S.I. Unit | Scalar or Vector |
| Displacement | ___________ | ___________ |
A car covers 90 km in `1 1/2` hours towards east. Calculate
- displacement of car,
- its velocity in (a) kmh−1 (b) ms−1.
Under what condition is the displacement of a body equal to the distance traveled by it?
Write two differences between distance and displacement.
A car starts from rest and moves along the x-axis with constant acceleration 5 ms–2 for 8 seconds. If it then continues with constant velocity, what distance will the car cover in 12 seconds since it started from the rest?
A scalar quantity has ______.
An ant moves from one corner of a room diagonally to the opposite corner. If the dimensions of the hall are 8m x 6m, the displacement of the ant is ______.
Distance travelled by a freely falling body is proportional to ______.
