Advertisements
Advertisements
प्रश्न
Concentrated settlements are found in Narmada Valley because of ______
पर्याय
Forested Land
Cultivable Land
Undulating topography
industries
उत्तर
Concentrated settlements are found in Narmada Valley because of Cultivable Land.
Explanation:
Concentrated/clustered/nucleated settlements are those in which the habitation regions are closed together and clustered. It is found mostly in the cultivable areas of the Narmada Valley, Bihar, Uttar Pradesh, and the Vindhyan plateau.
APPEARS IN
संबंधित प्रश्न
Prepare a multiple bar graph on the basis of the given information and answer the questions.
India and Brazil – Urban population (%)
| Country/ year | 2015 | 2016 | 2017 |
| India | 32.1 | 32.5 | 32.8 |
| Brazil | 84.7 | 84.9 | 85.1 |
1) What is the percentage of urban population in India in 2017?
2) In which country is the percentage of urban population higher?
3) What does the trend in urban population in both the countries indicate?
Give a geographical reason.
Urbanization is increasing rapidly in India.
Give geographical reason.
Except Delhi and Chandigarh, urbanization is low in other parts of India.
Write a comparative note on urbanisation in Brazil and India.
Some amenities and facilities are given here. Tick (correct) in the relevant column and complete the table on the basis of their presence in urban and rural areas or both. And write five sentences on each with examples from your vicinity.
| Amenity | Available in Villages |
Available in cities |
Explanation |
| Petrol Pump | |||
| Weekly Market | |||
| Primary Health centre |
|||
| Police Outpost | |||
| Art Gallery | |||
| Gram Panchayat | |||
| Agricultural Produce Market Committee (APMC) |
|||
| Primary School | |||
| Senior School | |||
| College | |||
| Shop | |||
| Multi-speciality Hospital |
|||
| Metro Station | |||
| Bus Station | |||
| University |
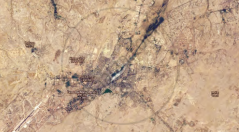
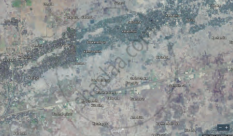
Tell whether settlements shown in images (a) and (b) are urban or rural.
|
(a) |
(b) |
With the help of given statistical data showing the percentages of urbanisation in India and Brazil for three decades, prepare a simple bar graph and answer the following questions :
| Year | 1990 | 2000 | 2010 |
| Brazil | 74.6 | 81.5 | 84.6 |
| India | 25.7 | 27.8 | 31.2 |
- In which decade the trend of urbanization was higher in Brazil?
- In which decade does the urbanization in India appear to be rapid?
- Compare the differences in the percentages of urbanization in both countries. In which decade is the difference in the percentage of urbanization the highest?
Read the graph given below and answer the following questions:
|
India-trend of urbanisation (1961-2011) |
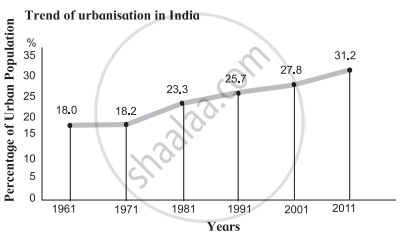
- What was the percentage of urbanisation in 1961?
- In which decade was urbanisation the highest?
- In which decade was the growth of urbanisation lowest?
- What inference can you draw regarding India’s urbanisation after reading the graph?
Mark the following in the outline map of India. Write the names and give index:
- Union territory - Daman
- Heavy rainfall region to the west coast
- Cold desert
- Region to the north having high density of population
- Kanyakumari
- Chilka lake
With the help of given statistical data, prepare a simple bar graph and answer the following questions:
Trend of Urbanisation in India (1961 to 2011)
| Year | Percentage % of Urban Population in India |
| 1961 | 18.0 |
| 1971 | 18.2 |
| 1981 | 23.3 |
| 1991 | 25.7 |
| 2001 | 27.8 |
| 2011 | 31.2 |
- What was the percentage of urbanisation in the year 1961?
- In which decade was the growth of urbanisation lowest?
- What was the percentage of urbanisation in the year 1991?
