Advertisements
Advertisements
प्रश्न
Define Data Visualization.
उत्तर
Data Visualization is the graphical representation of information and data. The objective of Data Visualization is to communicate information visually to users. For this, data visualization uses statistical graphics. Numerical data may be encoded using dots, lines, or bars, to visually communicate a quantitative message.
APPEARS IN
संबंधित प्रश्न
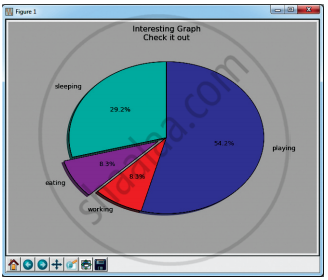
Write the plot for the following pie chart output.
Draw the output for the following data visualization plot.
import matplotlib.pyplot as plt
plt.bar([1,3,5,7,9],[5,2,7,8,2], label="Example one") plt.bar([2,4,6,8,10],[8,6,2,5,6], label="Example two", color='g')
plt.legend()
plt.xlabel('bar number')
plt.ylabel('bar height')
plt.title('Epic Graph\nAnother Line! Whoa')
plt.show()
Write the coding for the following:
To check if PIP is Installed on your PC.
Write the coding for the following:
To list the packages in matplotlib.
List the general types of data visualization.
List the types of Visualizations in Matplotlib.
Read the following code: Identify the purpose of this code and choose the right option from the following.
C:\Users\YourName\AppData\Local\Programs\Python\Python36-32\Scripts>pip – version
Read the following code: Identify the purpose of this code and choose the right option from the following.
C:\Users\Your Name\AppData\Local\Programs\Python\Python36-32\Scripts>pip list
Which key is used to run the module?
Identify the package manager for Python packages, or modules.
