Advertisements
Chapters
2: Data Abstraction
3: Scoping
4: Algorithmic Strategies
5: Python - Variables and Operators
6: Control Structures
7: Python functions
8: Strings and String manipulation
9: Lists, Tuples, Sets and Dictionary
10: Python Classes and objects
11: Database Concepts
12: Structured Query Language (SQL)
13: Python and CSV files
14: Importing C++ programs in Python
15: Data manipulation through SQL
▶ 16: Data visualization using pyplot: line chart, pie chart and bar chart
![Samacheer Kalvi solutions for Computer Science [English] Class 12 TN Board chapter 16 - Data visualization using pyplot: line chart, pie chart and bar chart Samacheer Kalvi solutions for Computer Science [English] Class 12 TN Board chapter 16 - Data visualization using pyplot: line chart, pie chart and bar chart - Shaalaa.com](/images/computer-science-english-class-12-tn-board_6:5f2b1b2038084cf381bfa42c826a928c.jpg)
Advertisements
Solutions for Chapter 16: Data visualization using pyplot: line chart, pie chart and bar chart
Below listed, you can find solutions for Chapter 16 of Tamil Nadu Board of Secondary Education Samacheer Kalvi for Computer Science [English] Class 12 TN Board.
Samacheer Kalvi solutions for Computer Science [English] Class 12 TN Board 16 Data visualization using pyplot: line chart, pie chart and bar chart Evaluation [Pages 330 - 334]
Part I - Choose the best answer (1 Marks)
Which is a python package used for 2D graphics?
matplotlib.pyplot
matplotlib.pip
matplotlib.numpy
matplotlib.plt
Identify the package manager for Python packages, or modules.
Matplotlib
PIP
plt.show()
python package
Read the following code: Identify the purpose of this code and choose the right option from the following.
C:\Users\YourName\AppData\Local\Programs\Python\Python36-32\Scripts>pip – version
Check if PIP is Installed
Install PIP
Download a Package
Check PIP version
Read the following code: Identify the purpose of this code and choose the right option from the following.
C:\Users\Your Name\AppData\Local\Programs\Python\Python36-32\Scripts>pip list
List installed packages
list command
Install PIP
packages installed
To install matplotlib, the following function will be typed in your command prompt. What does “-U” represents?
Python –m pip install –U pip
downloading pip to the latest version
upgrading pip to the latest version
removing pip
upgrading matplotlib to the latest version
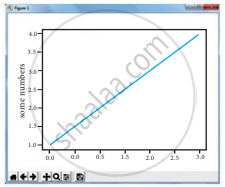
Observe the output figure. Identify the coding for obtaining this output.

import matplotlib.pyplot as plt
plt.plot([1,2,3],[4,5,1])
plt.show()import matplotlib.pyplot as
plt plt.plot([1,2],[4,5])
plt.show()import matplotlib.pyplot as plt
plt.plot([2,3],[5,1])
plt.show()import matplotlib.pyplot as plt
plt.plot([1,3],[4,1])
plt.show()
Read the code:
a. import matplotlib.pyplot as plt
b. plt.plot(3,2)
c. plt.show()
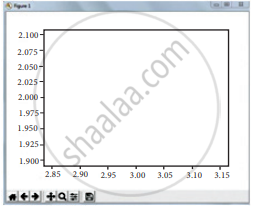
Identify the output for the above coding.
Which key is used to run the module?
F6
F4
F3
F5
Identify the right type of chart using the following hints.
Hint 1: This chart is often used to visualize a trend in data over intervals of time.
Hint 2: The line in this type of chart is often drawn chronologically.
Line chart
Bar chart
Pie chart
Scatter plot
Read the statements given below. Identify the right option from the following pie chart.
Statement A: To make a pie chart with Matplotlib, we can use the plt.pie() function.
Statement B: The autopct parameter allows us to display the percentage value using the Python string formatting.
Statement A is correct.
Statement B is correct.
Both the statements are correct.
Both the statements are wrong.
Part II - Answer the following questions (2 Marks)
Define Data Visualization.
List the general types of data visualization.
List the types of Visualizations in Matplotlib.
How will you install Matplotlib?
Write the difference between the following functions: plt.plot([1,2,3,4]), plt.plot([1,2,3,4], [1,4,9,16]).
Part III - Answer the following questions (3 Marks)
Draw the output for the following data visualization plot.
import matplotlib.pyplot as plt
plt.bar([1,3,5,7,9],[5,2,7,8,2], label="Example one") plt.bar([2,4,6,8,10],[8,6,2,5,6], label="Example two", color='g')
plt.legend()
plt.xlabel('bar number')
plt.ylabel('bar height')
plt.title('Epic Graph\nAnother Line! Whoa')
plt.show()
Write any three uses of data visualization.
Write the coding for the following:
To check if PIP is Installed on your PC.
Write the coding for the following:
To check the version of PIP installed on your PC.
Write the coding for the following:
To list the packages in matplotlib.
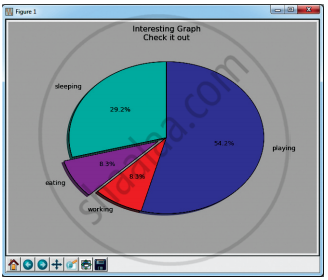
Write the plot for the following pie chart output.

Part IV - Answer the following questions (5 Marks)
Explain in detail the types of pyplots using Matplotlib.
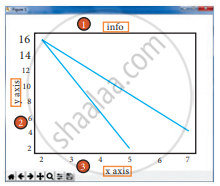
Explain the various buttons in a matplotlib window.
Explain the purpose of the following function:
plt.xlabel
Explain the purpose of the following function:
plt.ylabel
Explain the purpose of the following function:
plt.title
Explain the purpose of the following function:
plt.legend()
Explain the purpose of the following function:
plt.show()
Solutions for 16: Data visualization using pyplot: line chart, pie chart and bar chart
![Samacheer Kalvi solutions for Computer Science [English] Class 12 TN Board chapter 16 - Data visualization using pyplot: line chart, pie chart and bar chart Samacheer Kalvi solutions for Computer Science [English] Class 12 TN Board chapter 16 - Data visualization using pyplot: line chart, pie chart and bar chart - Shaalaa.com](/images/computer-science-english-class-12-tn-board_6:5f2b1b2038084cf381bfa42c826a928c.jpg)
Samacheer Kalvi solutions for Computer Science [English] Class 12 TN Board chapter 16 - Data visualization using pyplot: line chart, pie chart and bar chart
Shaalaa.com has the Tamil Nadu Board of Secondary Education Mathematics Computer Science [English] Class 12 TN Board Tamil Nadu Board of Secondary Education solutions in a manner that help students grasp basic concepts better and faster. The detailed, step-by-step solutions will help you understand the concepts better and clarify any confusion. Samacheer Kalvi solutions for Mathematics Computer Science [English] Class 12 TN Board Tamil Nadu Board of Secondary Education 16 (Data visualization using pyplot: line chart, pie chart and bar chart) include all questions with answers and detailed explanations. This will clear students' doubts about questions and improve their application skills while preparing for board exams.
Further, we at Shaalaa.com provide such solutions so students can prepare for written exams. Samacheer Kalvi textbook solutions can be a core help for self-study and provide excellent self-help guidance for students.
Concepts covered in Computer Science [English] Class 12 TN Board chapter 16 Data visualization using pyplot: line chart, pie chart and bar chart are Data Visualization Definition, Getting Started, Special Plot Types.
Using Samacheer Kalvi Computer Science [English] Class 12 TN Board solutions Data visualization using pyplot: line chart, pie chart and bar chart exercise by students is an easy way to prepare for the exams, as they involve solutions arranged chapter-wise and also page-wise. The questions involved in Samacheer Kalvi Solutions are essential questions that can be asked in the final exam. Maximum Tamil Nadu Board of Secondary Education Computer Science [English] Class 12 TN Board students prefer Samacheer Kalvi Textbook Solutions to score more in exams.
Get the free view of Chapter 16, Data visualization using pyplot: line chart, pie chart and bar chart Computer Science [English] Class 12 TN Board additional questions for Mathematics Computer Science [English] Class 12 TN Board Tamil Nadu Board of Secondary Education, and you can use Shaalaa.com to keep it handy for your exam preparation.


