Advertisements
Advertisements
प्रश्न
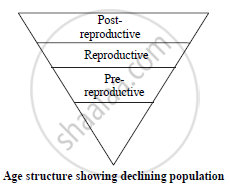
Describe diagrammatic representation of age structure showing declining population.
उत्तर
a. The relative proportion of individuals of various age groups in the population is called
age structure of the population.
b. Age structure of a population is the percentage of individuals of different age groups such as young (0-14 years), adults (15-59 years) and old (60 years and above).
c. The distribution of these age groups determine the trend of population.

d. In declining population, number of post reproductive age group is large whereas the number of pre reproductive age group is small.
e. Thus, the age structure shows declining population.
APPEARS IN
संबंधित प्रश्न
Describe steady population with the help of a pyramid.
Construct an age pyramid which reflects an expanding growth status of human population.
In literacy rate, TN ranks
Which district has the lowest child sex ratio?
In human development index, TN is ranked
Describe the qualitative aspects of population.
Complete the given analogy.
Mortality: No. of deaths in a population during a given period:: Emigration: ____________.
A biologist studied the population of rats in a barn. He found that the average natality was 300, average mortality 250, immigration 50 and emigration 100. The net increase in population is ____________.
In a population, natality is used to represent ____________.
Calculate the birth rate if a population of 150 Paramoecium present in a pool increases to 450 after an hour.
