Advertisements
Advertisements
Question
Describe diagrammatic representation of age structure showing declining population.
Solution
a. The relative proportion of individuals of various age groups in the population is called
age structure of the population.
b. Age structure of a population is the percentage of individuals of different age groups such as young (0-14 years), adults (15-59 years) and old (60 years and above).
c. The distribution of these age groups determine the trend of population.
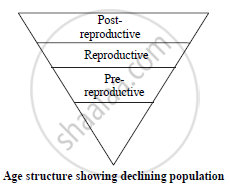
d. In declining population, number of post reproductive age group is large whereas the number of pre reproductive age group is small.
e. Thus, the age structure shows declining population.
APPEARS IN
RELATED QUESTIONS
In sex ratio, Tamil Nadu ranks
In literacy rate, TN ranks
Identify the type of growth in the given figure of age pyramid.
Age pyramid
Which phase of the Logistic growth curve shows that the population density has reached the canying capacity in a habitat with limited resources?
What can you interpret from an age pyramid with a broad base?
Which of the following situations contributes to increase in density of population?
The type of natality that is relative to a specific criterion such as age is ______.
Which of the following conditions represents zero population growth?
The aggregate of processes that determine the size and composition of any population is called ______.
Explain the term Emigration.
