Advertisements
Advertisements
प्रश्न
Draw a graph to show the variation in density of water with temperature in the range from 0°C to 10°C.
उत्तर

APPEARS IN
संबंधित प्रश्न
Calculate the time required to heat 20 kg of water from 10°C to 35°C using an immersion heater rated 1000 W. Assume that 80% of the power input is used to heat the water. Specific heat capacity of water = 42000 J kg−1 K−1.
Water is cooled from 4 °C to 0 °C. It will :
Draw a graph between volume and temperature, when 5 cm3 of ice at -10°C is heated to form water at +10°C.
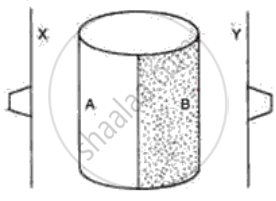
The following figure shows a metal cylinder, containing boiling water. One half side A is polished and another half, B is painted black. Two thin metal sheets X and Y are painted black and have one rubber stopper fixed with wax on each sheet. These sheets are equidistant from the boiling water (container A, B) as shown in the diagram. What would you expect to happen after a few minutes? Give a reason for your answer.
Observe the given graph and answer the following questions:
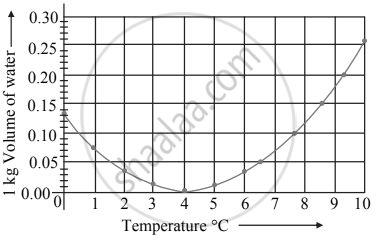
- Name the process represented in the figure.
- At what temperature does this process take place?
When the temperature of water decreases below 4 °C it’s volume _______.
_______ apparatus is used to study the anomalous behaviour of water.
Name the following diagram appropriately.

