Advertisements
Advertisements
Question
Draw a graph to show the variation in density of water with temperature in the range from 0°C to 10°C.
Solution

APPEARS IN
RELATED QUESTIONS
Explain the following:
How can you relate the formation of water droplets on the outer surface of a bottle taken out of refrigerator with formation of dew?
Explain the following:
In cold regions in winter, the rocks crack due to anomalous expansion of water.
1 kg of ice at 0°C is mixed with 1 kg of steam at 100°C. What will be the composition of the system when thermal equilibrium is reached? Latent heat of fusion of ice = 3.36 × 10³ J kg−1 and latent heat of vaporization of water = 2.26 × 10⁶ J kg−1.
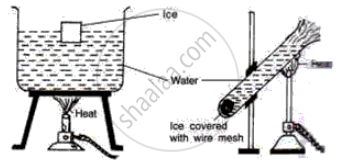
Study the following diagrams and write down your observations.
In a region with a cold climate the aquatic animals can survive at 4 °C, because _______.
Write the name.
The instrument used to study anomalous behaviour of water.
Observe the following diagram and write the answers to the questions given below.
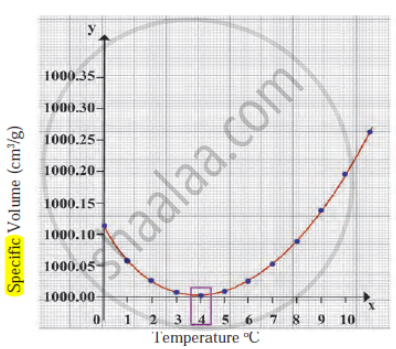
- Which process does the graph represent?
- What is the range of temperature responsible for the behaviour?
Write a short note.
Anomalous behaviour of water
