Advertisements
Advertisements
Question
Observe the following diagram and write the answers to the questions given below.
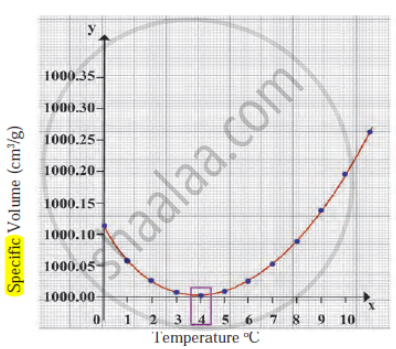
- Which process does the graph represent?
- What is the range of temperature responsible for the behaviour?
Answer in Brief
Solution
- The graph represents anomalous behaviour of water.
- The range of temperature responsible for the behaviour is 0 °C to 4 °C.
shaalaa.com
Anomalous Expansion of Water
Is there an error in this question or solution?
