Advertisements
Advertisements
प्रश्न
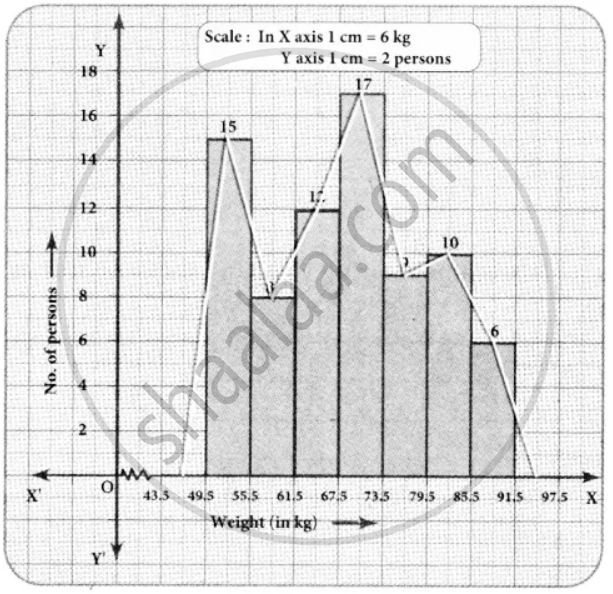
Draw a histogram and the frequency polygon in the same diagram to represent the following data
| Weight (in kg) | 50 − 55 | 56 − 61 | 62 − 67 | 68 − 73 | 74 − 79 | 80 − 85 | 86 − 91 |
| No. of persons | 15 | 8 | 12 | 17 | 9 | 10 | 6 |
उत्तर
The given distribution is discontinuous.
Lower boundary = lower limit – `1/2` ...(gap between the adjacent class interval)
= `50 - 1/2` (1) = 49.5
Upper boundary = Upper limit + `1/2` ...(gap between the adjacent class interval)
= `55 + 1/2` (1) = 55.5
∴ The continuous frequency table is as below.
| Weight (in kg) | 49.5 − 55.5 | 55.5 − 61.5 | 61.5 − 67.5 | 67.5 − 73.5 | 73.5 − 79.5 | 79.5 − 85.5 | 85.5 − 91.5 |
| No. of persons | 15 | 8 | 12 | 17 | 9 | 10 | 6 |
APPEARS IN
संबंधित प्रश्न
Draw histogram for the following frequency distributions:
| Class Interval | 0 – 10 | 10 – 20 | 20 – 30 | 30 – 40 | 40 – 50 | 50 – 60 |
| Frequency | 12 | 20 | 26 | 18 | 10 | 6 |
| Result (Percentage) | 30 - 40 | 40 - 50 | 50 - 60 | 60 -70 | 70 - 80 | 80 - 90 | 90 - 100 |
| No. of students | 7 | 33 | 45 | 65 | 47 | 18 | 5 |
Draw a histogram for the daily earnings of 30 drug stores in the following table:
| Daily earnings (in Rs): | 450−500 | 500−550 | 550−600 | 600−650 | 650−700 |
| Numbers of stores: | 16 | 10 | 7 | 3 | 1 |
Find the lower quartile, the upper quartile, the interquartile range and the semi-interquartile range for the following frequency distributions:
| Variate | 10 | 11 | 12 | 13 | 14 | 15 | 16 | 17 | 18 | 19 | 20 |
| Frequency | 1 | 2 | 3 | 1 | 2 | 4 | 2 | 1 | 1 | 2 | 1 |
Following table present educational level (middle stage) of females in Arunachal pradesh according to 1981 census:
| Age group | Number of females (to the nearest ten) |
| 10 - 14 | 300 |
| 15 - 19 | 980 |
| 20 - 24 | 800 |
| 25 - 29 | 380 |
| 30 - 34 | 290 |
Draw a histogram to represent the above data.
The time taken, in seconds, to solve a problem for each of 25 persons is as follows:
| 16 | 20 | 26 | 27 | 28 |
| 30 | 33 | 37 | 38 | 40 |
| 42 | 43 | 46 | 46 | 47 |
| 48 | 49 | 50 | 53 | 58 |
| 59 | 60 | 64 | 52 | 20 |
(i) Construct a frequency distribution for these data using a class interval of 10 seconds.
(ii) In a school the weekly pocket money of 50 students is as follow's:
| Weekly pocket money (₹) | No. of student |
| 40 - 50 | 2 |
| 59 - 60 | 8 |
| 60 - 70 | 12 |
| 70 - 80 | 14 |
| 80 - 90 | 8 |
| 90 - 100 | 6 |
Draw a histogram and a frequency polygon on the same graph. Find mode from the graph.
The marks obtained by 50 students in Mathematics are given below.
(i) Make a frequency distribution table taking a class size of 10 marks
(ii) Draw a histogram and a frequency polygon.
| 52 | 33 | 56 | 52 | 44 | 59 | 47 | 61 | 49 | 61 |
| 47 | 52 | 67 | 39 | 89 | 57 | 64 | 58 | 63 | 65 |
| 32 | 64 | 50 | 54 | 42 | 48 | 22 | 37 | 59 | 63 |
| 36 | 35 | 48 | 48 | 55 | 62 | 74 | 43 | 41 | 51 |
| 08 | 71 | 30 | 18 | 43 | 28 | 20 | 40 | 58 | 49 |
Form a continuous frequency distribution table and draw histogram from the following data.
| Age (in years) | No. of persons |
| Under 5 | 1 |
| Under 10 | 12 |
| Under 15 | 19 |
| Under 20 | 26 |
| Under 25 | 27 |
| Under 30 | 35 |
| Under 35 | 38 |
| Under 40 | 45 |
| Under 45 | 48 |
| Under 50 | 53 |
Histogram shows the number of people owning the different number of books. Answer the question based on it.
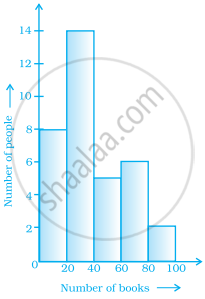
The number of people owning books more than 60 is ______.
Histogram shows the number of people owning the different number of books. Answer the question based on it.

The number of people having books more than 20 and less than 40 is ______.
