Advertisements
Advertisements
Question
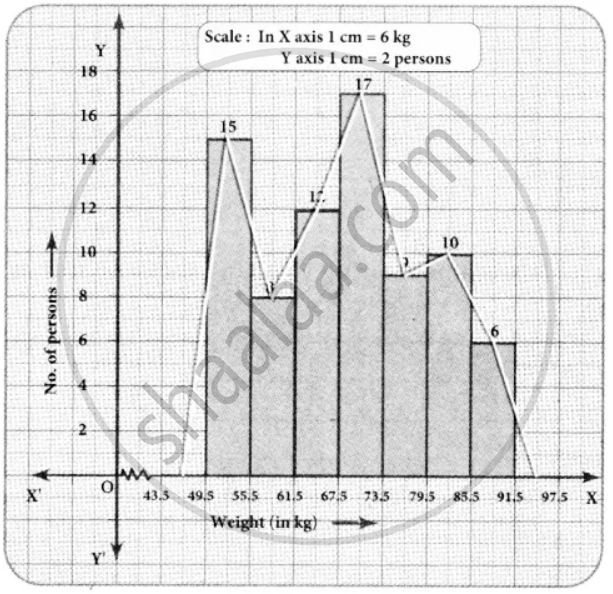
Draw a histogram and the frequency polygon in the same diagram to represent the following data
| Weight (in kg) | 50 − 55 | 56 − 61 | 62 − 67 | 68 − 73 | 74 − 79 | 80 − 85 | 86 − 91 |
| No. of persons | 15 | 8 | 12 | 17 | 9 | 10 | 6 |
Solution
The given distribution is discontinuous.
Lower boundary = lower limit – `1/2` ...(gap between the adjacent class interval)
= `50 - 1/2` (1) = 49.5
Upper boundary = Upper limit + `1/2` ...(gap between the adjacent class interval)
= `55 + 1/2` (1) = 55.5
∴ The continuous frequency table is as below.
| Weight (in kg) | 49.5 − 55.5 | 55.5 − 61.5 | 61.5 − 67.5 | 67.5 − 73.5 | 73.5 − 79.5 | 79.5 − 85.5 | 85.5 − 91.5 |
| No. of persons | 15 | 8 | 12 | 17 | 9 | 10 | 6 |
APPEARS IN
RELATED QUESTIONS
Draw the frequency polygon for the following frequency distribution
| Rainfall (in cm) | No. of Years |
| 20 — 25 | 2 |
| 25 — 30 | 5 |
| 30 — 35 | 8 |
| 35 — 40 | 12 |
| 40 — 45 | 10 |
| 45 — 50 | 7 |
Given below is the frequency distribution of driving speeds (in km/hour) of the vehicles of 400 college students:
| Speed (in km/hr) | No. of Students |
| 20-30 | 6 |
| 30-40 | 80 |
| 40-50 | 156 |
| 50-60 | 98 |
60-70 |
60 |
Draw Histogram and hence the frequency polygon for the above data.
The following histogram shows the number of literate females in the age group of 10 to 40 years in a town: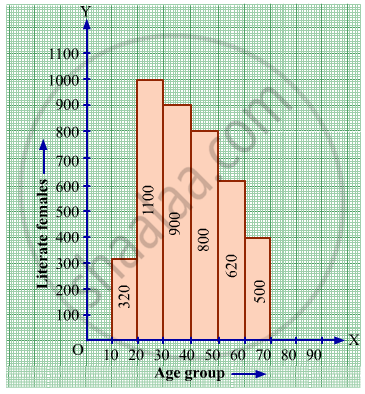
(i) Write the age group in which the number of literate female is the highest.
(ii) What is the class width?
(iii) What is the lowest frequency?
(iv) What are the class marks of the classes?
(v) In which age group literate females are the least?
Construct histograms for following frequency distribution:
| Class Interval | 0-10 | 10-20 | 20-30 | 30-40 | 40-50 | 50-60 |
| Frequency | 8 | 20 | 34 | 22 | 10 | 6 |
Draw the Histogram and hence, the frequency polygon for the following frequency distribution:
| House Rent (In ₹ per month) | 400-600 | 600-800 | 800-1000 | 1000-1200 |
| Number of families | 200 | 240 | 300 | 50 |
Draw a histogram and frequency polygon to represent the following data (on the same scale) which shows the monthly cost of living index of a city in a period of 2 years:
| Cost of living Index | Number of months |
| 440 - 460 | 2 |
| 460 - 480 | 4 |
| 480 - 500 | 3 |
| 500 - 520 | 5 |
| 520 - 540 | 3 |
| 540 - 560 | 2 |
| 560 - 580 | 1 |
| 580 - 600 | 4 |
| Total | 24 |
Identify the following data can be represented in a histogram?
The number of mountain climbers in the age group 20 to 60 in Tamil Nadu.
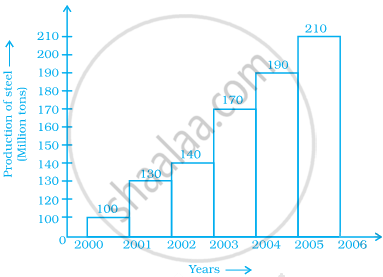
Identify the following data can be represented in a histogram?
Production of cycles in different years
The number of people owning books more than 60 is ______.
The following pictorial representation of data is a histogram.