Advertisements
Advertisements
Question
Form a continuous frequency distribution table and draw histogram from the following data.
| Age (in years) | No. of persons |
| Under 5 | 1 |
| Under 10 | 12 |
| Under 15 | 19 |
| Under 20 | 26 |
| Under 25 | 27 |
| Under 30 | 35 |
| Under 35 | 38 |
| Under 40 | 45 |
| Under 45 | 48 |
| Under 50 | 53 |
Solution
Converting into continuous distribution we have
| Class interval | No. of persons |
| 0 – 5 | 1 |
| 5 – 10 | 11 |
| 10 – 15 | 7 |
| 15 – 20 | 7 |
| 20 – 25 | 1 |
| 25 – 30 | 8 |
| 30 – 35 | 3 |
| 35 – 40 | 7 |
| 40 – 45 | 3 |
| 45 – 50 | 5 |
| Total | 53 |

APPEARS IN
RELATED QUESTIONS
The weekly wages (in Rs.) of 30 workers in a factory are given:
830, 835, 890, 810, 835, 836, 869, 845, 898, 890, 820, 860, 832, 833, 855, 845, 804, 808, 812, 840, 885, 835, 835, 836, 878, 840, 868, 890, 806, 840
Mark a frequency table with intervals as 800-810, 810-820 and so on, using tally marks. Also, draw a histogram and answer the following questions:
(i) Which group has the maximum number of workers?
(ii) How many workers earn Rs 850 and more?
(iii) How many workers earn less than Rs 850?
The following frequency distribution table shows marks obtained by 180 students in Mathematics examination.
| Marks | No. of students |
| 0 – 10 | 25 |
| 10 – 20 | x |
| 20 – 30 | 30 |
| 30 – 40 | 2x |
| 40 – 50 | 65 |
Find the value of x. Also draw a histogram representing the above information.
Construct histograms for following frequency distribution:
| Class Interval | 110-119 | 120-129 | 130-139 | 140-149 | 150-159 |
| Frequency | 15 | 23 | 30 | 20 | 16 |
Construct histograms for following frequency distribution:
| Class Interval | 130-140 | 140-150 | 150-160 | 160-170 | 170-180 |
| Frequency | 24 | 16 | 29 | 20 | 11 |
Construct a frequency polygon without using a histogram for the following frequency distribution :
| Class Mark | 10 | 15 | 20 | 25 | 30 | 35 | 40 |
| Frequency | 4 | 20 | 40 | 45 | 30 | 25 | 5 |
Draw a histogram to represent the following data:
| Pocket money in ₹ | No. of Students |
| 150 - 200 | 10 |
| 200 - 250 | 5 |
| 250 - 300 | 7 |
| 300 - 350 | 4 |
| 350 - 400 | 3 |
Draw a histogram for the following data.
| Mid Value (x) | 15 | 25 | 35 | 45 | 55 | 65 | 75 |
| Frequency (f) | 12 | 24 | 30 | 18 | 26 | 10 | 8 |
The following histogram shows the frequency distribution of teaching experiences of 30 teachers in various schools:

- What is the class width?
- How many teachers are having the maximum teaching experience and how many have the least teaching experience?
- How many teachers have teaching experience of 10 to 20 years?
Use graph paper for this question. Estimate the mode of the given distribution by plotting a histogram. [Take 2 cm = 10 marks along one axis and 2 cm = 5 students along the other axis]
| Daily wages (in ₹) | 30 - 40 | 40 - 50 | 50 - 60 | 60 - 70 | 70 - 80 |
| No. of Workers | 6 | 12 | 20 | 15 | 9 |
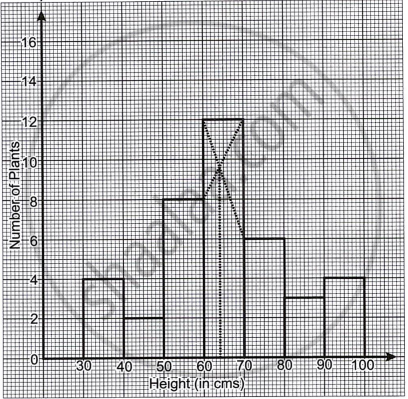
The given graph with a histogram represents the number of plants of different heights grown in a school campus. Study the graph carefully and answer the following questions:

- Make a frequency table with respect to the class boundaries and their corresponding frequencies.
- State the modal class.
- Identify and note down the mode of the distribution.
- Find the number of plants whose height range is between 80 cm to 90 cm.
