Advertisements
Advertisements
Question
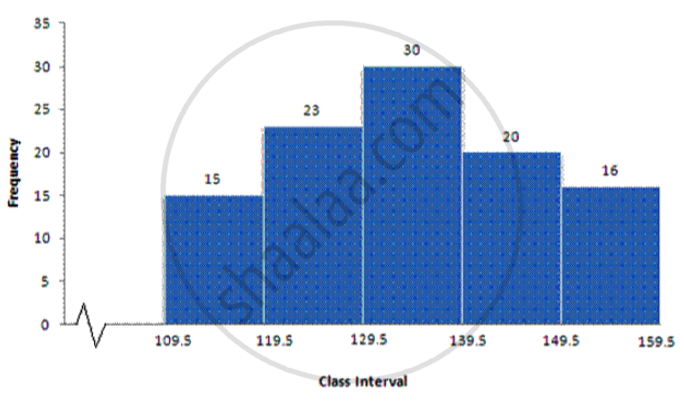
Construct histograms for following frequency distribution:
| Class Interval | 110-119 | 120-129 | 130-139 | 140-149 | 150-159 |
| Frequency | 15 | 23 | 30 | 20 | 16 |
Solution
Steps :
a. Make the class intervals continuous by subtracting 0.5 from the lower limit of each class and add 0.5 to the upper limit of each class.
b. On the x-axis , take 1 cm as 5 units and plot class intervals.
c. On the y-axis, take 1 cm as 5 units and plot frequency.
d. Draw rectangles of histogram as per given data.
| Class Interval | Frequency |
| 109.5-119.5 | 15 |
| 119.5-129.5 | 23 |
| 129.5-139.5 | 30 |
| 139.5-149.5 | 20 |
| 149.5-159.5 | 16 |
APPEARS IN
RELATED QUESTIONS
The marks scored by students in Mathematics in a certain Examination are given below:
| Marks Scored | Number of Students |
| 0 — 20 | 3 |
| 20 — 40 | 8 |
| 40 — 60 | 19 |
| 60 — 80 | 18 |
| 80 — 100 | 6 |
Draw histogram for the above data.
For which of these would you use a histogram to show the data?
(a) The number of letters for different areas in a postman’s bag.
(b) The height of competitors in an athletics meet.
(c) The number of cassettes produced by 5 companies.
(d) The number of passengers boarding trains from 7:00 a.m. to 7:00 p.m. at a station.
Give reasons for each.
The weekly wages (in Rs) of 30 workers in a factory are.
830, 835, 890, 810, 835, 836, 869, 845, 898, 890, 820, 860, 832, 833, 855, 845, 804, 808, 812, 840, 885, 835, 835, 836, 878, 840, 868, 890, 806, 840
Using tally marks make a frequency table with intervals as 800 − 810, 810 − 820 and so on.
Draw a histogram for the frequency table made for the data in Question 3 and answer the following questions.
(1) Which group has the maximum number of workers?
(2) How many workers earn Rs 850 and more?
(3) How many workers earn less than Rs 850?
A Mathematics aptitude test of 50 students was recorded as follows:
| Marks | 50 - 60 | 60 - 70 | 70 - 80 | 80 - 90 | 90 – 100 |
| No. of Students | 4 | 8 | 14 | 19 | 5 |
Draw a histogram from the above data using a graph paper and locate the mode.
Draw a histogram of the following data.
| Height of student (cm) | 135 - 140 | 140 - 145 | 145 - 150 | 150 - 155 |
| No. of students | 4 | 12 | 16 | 8 |
Draw a histogram of the following data:
| Class interval: | 10−15 | 15−20 | 20−25 | 25−30 | 30−35 | 34−40 |
| Frequency: | 30 | 98 | 80 | 58 | 29 | 50 |
Construct a histogram for the following data:
| Monthly school fee (in Rs): | 30−60 | 60−90 | 90−120 | 120−150 | 150−180 | 180−210 | 210−240 |
| Number of schools: | 5 | 12 | 14 | 18 | 10 | 9 | 4 |
The following histogram shows the monthly wages (in Rs) of workers in a factory: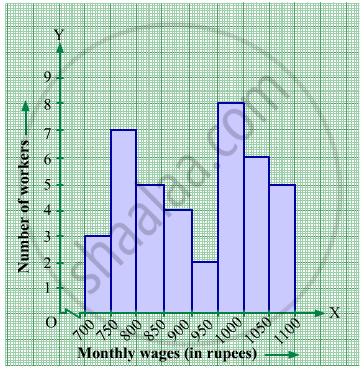
(i) In which wage-group the largest number of workers are being kept? What is their number?
(ii) What wages are the least number of workers getting? What is the number of such workers?
(iii) What is the total number of workers?
(iv) What is the factory size?
Draw histogram and hence the frequency polygon for the following frequency distribution:
| Rainfall (in cm) | No. of years |
| 20-25 | 2 |
| 25-30 | 5 |
| 30-35 | 8 |
| 35-40 | 12 |
| 40-45 | 10 |
| 45-50 | 7 |
Draw the Histogram and hence, the frequency polygon for the following frequency distribution:
| House Rent (In ₹ per month) | 400-600 | 600-800 | 800-1000 | 1000-1200 |
| Number of families | 200 | 240 | 300 | 50 |
Distribution of height in cm of 100 people is given below:
| Class interval (cm) | Frequency |
| 145 - 155 | 3 |
| 155 - 165 | 35 |
| 165 - 175 | 25 |
| 175 - 185 | 15 |
| 185 - 195 | 20 |
| 195 - 205 | 2 |
Draw a histogram to represent the above data.
The time taken, in seconds, to solve a problem for each of 25 persons is as follows:
| 16 | 20 | 26 | 27 | 28 |
| 30 | 33 | 37 | 38 | 40 |
| 42 | 43 | 46 | 46 | 47 |
| 48 | 49 | 50 | 53 | 58 |
| 59 | 60 | 64 | 52 | 20 |
(i) Construct a frequency distribution for these data using a class interval of 10 seconds.
(ii) In a school the weekly pocket money of 50 students is as follow's:
| Weekly pocket money (₹) | No. of student |
| 40 - 50 | 2 |
| 59 - 60 | 8 |
| 60 - 70 | 12 |
| 70 - 80 | 14 |
| 80 - 90 | 8 |
| 90 - 100 | 6 |
Draw a histogram and a frequency polygon on the same graph. Find mode from the graph.
Identify the following data can be represented in a histogram?
The number of students in each class of a school
A graph that displays data that changes continuously over the periods of time is _________
In a village, there are 570 people who have cell phones. An NGO survey their cell phone usage. Based on this survey a histogram is drawn
How many people use the cell phone for less than 3 hours?
Try yourself
- Next time when you watch your favourite TV programme, count the number of advertisements during each break. Use tally marks. Put a dot below the tally when you find children in any advertisement.
- Compare with your friends. Do you get different answers?
Prepare a histogram from the frequency distribution table obtained in question 93.
Use graph paper for this question. Estimate the mode of the given distribution by plotting a histogram. [Take 2 cm = 10 marks along one axis and 2 cm = 5 students along the other axis]
| Daily wages (in ₹) | 30 - 40 | 40 - 50 | 50 - 60 | 60 - 70 | 70 - 80 |
| No. of Workers | 6 | 12 | 20 | 15 | 9 |
Show the following data by a frequency polygon:
| Electricity bill (₹) | Families |
| 200 – 400 | 240 |
| 400 – 600 | 300 |
| 600 – 800 | 450 |
| 800 – 1000 | 350 |
| 1000 – 1200 | 160 |
