Advertisements
Advertisements
Question
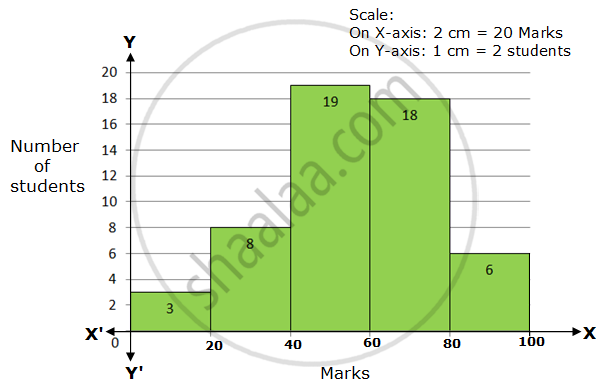
The marks scored by students in Mathematics in a certain Examination are given below:
| Marks Scored | Number of Students |
| 0 — 20 | 3 |
| 20 — 40 | 8 |
| 40 — 60 | 19 |
| 60 — 80 | 18 |
| 80 — 100 | 6 |
Draw histogram for the above data.
Advertisements
Solution
RELATED QUESTIONS
Draw the frequency polygon for the following frequency distribution
| Rainfall (in cm) | No. of Years |
| 20 — 25 | 2 |
| 25 — 30 | 5 |
| 30 — 35 | 8 |
| 35 — 40 | 12 |
| 40 — 45 | 10 |
| 45 — 50 | 7 |
Given below is the frequency distribution of driving speeds (in km/hour) of the vehicles of 400 college students:
| Speed (in km/hr) | No. of Students |
| 20-30 | 6 |
| 30-40 | 80 |
| 40-50 | 156 |
| 50-60 | 98 |
60-70 |
60 |
Draw Histogram and hence the frequency polygon for the above data.
Represent the following data by Histogram:
|
Price of Sugar per kg (in Rs.) |
Number of Weeks |
| 18-20 | 4 |
| 20-22 | 8 |
| 22-24 | 22 |
| 24-26 | 12 |
| 26-28 | 8 |
| 28-30 | 6 |
The weekly wages (in Rs) of 30 workers in a factory are.
830, 835, 890, 810, 835, 836, 869, 845, 898, 890, 820, 860, 832, 833, 855, 845, 804, 808, 812, 840, 885, 835, 835, 836, 878, 840, 868, 890, 806, 840
Using tally marks make a frequency table with intervals as 800 − 810, 810 − 820 and so on.
Draw histogram for the following frequency distributions:
| Class Interval | 10 – 16 | 16 – 22 | 22 – 28 | 28 – 34 | 34 – 40 |
| Frequency | 15 | 23 | 30 | 20 | 16 |
Draw histogram for the following frequency distributions:
| Class Interval | 30 – 39 | 40 – 49 | 50 – 59 | 60 – 69 | 70 – 79 |
| Frequency | 24 | 16 | 09 | 15 | 20 |
Draw a histogram of the following data.
| Height of student (cm) | 135 - 140 | 140 - 145 | 145 - 150 | 150 - 155 |
| No. of students | 4 | 12 | 16 | 8 |
In the following table, the investment made by 210 families is shown. Present it in the form of a histogram.
|
Investment
(Thousand Rupees) |
10 - 15 | 15 - 20 | 20 - 25 | 25 - 30 | 30 - 35 |
| No. of families | 30 | 50 | 60 | 55 | 15 |
Time alloted for the preparation of an examination by some students is shown in the table. Draw a histogram to show the information.
| Time (minutes) | 60 - 80 | 80 - 100 | 100 - 120 | 120 - 140 | 140 - 160 |
| No. of students | 14 | 20 | 24 | 22 | 16 |
Find the correct answer from the alternatives given.
|
No. of trees planted by each student |
1 - 3 | 4 - 6 | 7 - 9 | 10 - 12 |
| No. of students | 7 | 8 | 6 | 4 |
The above data is to be shown by a frequency polygon. The coordinates of the points to show number of students in the class 4-6 are . . . .
Construct a histogram for the following data:
| Monthly school fee (in Rs): | 30−60 | 60−90 | 90−120 | 120−150 | 150−180 | 180−210 | 210−240 |
| Number of schools: | 5 | 12 | 14 | 18 | 10 | 9 | 4 |
Draw a histogram for the daily earnings of 30 drug stores in the following table:
| Daily earnings (in Rs): | 450−500 | 500−550 | 550−600 | 600−650 | 650−700 |
| Numbers of stores: | 16 | 10 | 7 | 3 | 1 |
Draw a histogram and frequency polygon to represent the following data (on the same scale) which shows the monthly cost of living index of a city in a period of 2 years:
| Cost of living Index | Number of months |
| 440 - 460 | 2 |
| 460 - 480 | 4 |
| 480 - 500 | 3 |
| 500 - 520 | 5 |
| 520 - 540 | 3 |
| 540 - 560 | 2 |
| 560 - 580 | 1 |
| 580 - 600 | 4 |
| Total | 24 |
Draw the histogram for the following frequency distribution and hence estimate the mode for the distribution.
| Class | Frequency |
| 0 - 5 | 2 |
| 5 - 10 | 7 |
| 10 - 15 | 18 |
| 15 - 20 | 10 |
| 20 - 25 | 8 |
| 25 - 30 | 5 |
| Total | 24 |
In a village, there are 570 people who have cell phones. An NGO survey their cell phone usage. Based on this survey a histogram is drawn
How many people use the cell phone for less than 3 hours?
Draw a histogram for the following data.
| Mid Value (x) | 15 | 25 | 35 | 45 | 55 | 65 | 75 |
| Frequency (f) | 12 | 24 | 30 | 18 | 26 | 10 | 8 |
Try yourself
- Next time when you watch your favourite TV programme, count the number of advertisements during each break. Use tally marks. Put a dot below the tally when you find children in any advertisement.
- Compare with your friends. Do you get different answers?
Histogram shows the number of people owning the different number of books. Answer the question based on it.
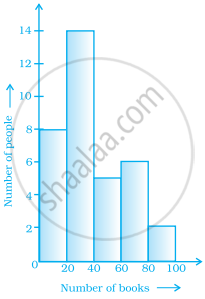
The number of people owning books less than 40 is ______.
Prepare a histogram from the frequency distribution table obtained in question 93.
Show the following data by a frequency polygon:
| Electricity bill (₹) | Families |
| 200 – 400 | 240 |
| 400 – 600 | 300 |
| 600 – 800 | 450 |
| 800 – 1000 | 350 |
| 1000 – 1200 | 160 |
