Advertisements
Advertisements
प्रश्न
Draw a histogram for the following distribution and estimate the mode:
| I.Q. Score | 80-100 | 100-120 | 120-140 | 140-160 | 160-180 | 180-200 |
| No. of Students | 6 | 9 | 16 | 13 | 4 | 2 |
उत्तर
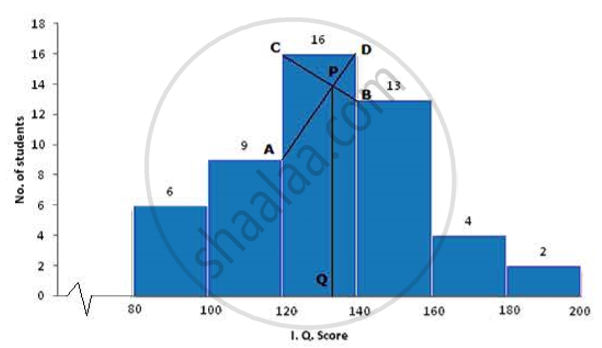
(a) Take 1cm = 1 unit and plot I. Q. Score on x-axis and no. of students on y axis.
(b) Draw a bar graph for the given data.
(c) From the histogram it is clear that class 120-140 has highest frequency i.e. 16
(d) Join the ends of the corresponding frequencies which meet at P and drop a perpendicular on the x-axis from P to Q. Q is the mode.
Therefore, Mode = 134
APPEARS IN
संबंधित प्रश्न
The marks of 10 students of a class in an examination arranged in ascending order is as follows:
13, 35, 43, 46, x, x + 4, 55, 61, 71, 80
If the median marks is 48, find the value of x. Hence, find the mode of the given data.
Marks obtained (in mathematics) by 9 students are given below:
60, 67, 52, 76, 50, 51, 74, 45 and 56
- Find the arithmetic mean.
- If marks of each student be increased by 4; what will be the new value of arithmetic mean?
The following table gives the weekly wages of workers in a factory.
| Weekly wages (Rs) | No. of workers |
| 50 – 55 | 5 |
| 55 – 60 | 20 |
| 60 – 65 | 10 |
| 65 – 70 | 10 |
| 70 – 75 | 9 |
| 75 – 80 | 6 |
| 80 – 85 | 12 |
| 85 – 90 | 8 |
Calculate the mean by using:
Direct Method
Using step-deviation method, calculate the mean marks of the following distribution.
| C.I. | 50 – 55 | 55 – 60 | 60 – 65 | 65 – 70 | 70 – 75 | 75 – 80 | 80 – 85 | 85 – 90 |
| Frequency | 5 | 20 | 10 | 10 | 9 | 6 | 12 | 8 |
For the following set of data, find the median:
10, 75, 3, 81, 17, 27, 4, 48, 12, 47, 9 and 15.
Draw a histogram for the following distribution and estimate the mode:
| Marks | 0-10 | 10-20 | 20-30 | 30-40 | 40-50 | 50-60 | 60-70 | 70-80 |
| No. of students | 3 | 7 | 15 | 24 | 16 | 8 | 5 | 2 |
Find the median of:
241, 243, 347, 350, 327, 299, 261, 292, 271, 258 and 257
Find the mean of 53, 61, 60, 67 and 64.
Find the median of 3.2, 4.8, 5.6, 5.6, 7.3, 8.9 and 9.1
The median of first ten even natural numbers is ___________
