Advertisements
Advertisements
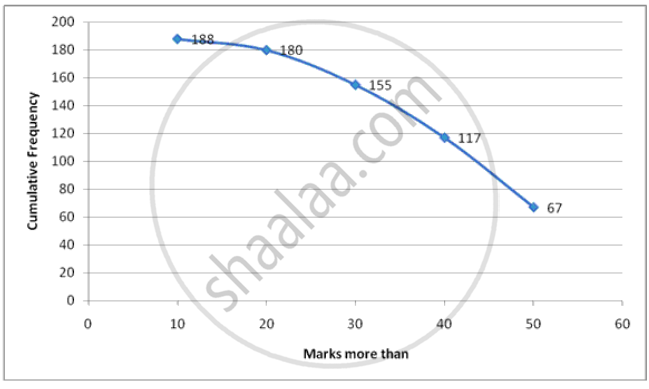
प्रश्न
Draw an ogive for the following :
| Marks obtained | More than 10 | More than 20 | More than 30 | More than 40 | More than 50 |
| No. of students | 8 | 25 | 38 | 50 | 67 |
उत्तर
Steps :
1. Start with lower limits of class intervals and from cumulative frequency , subtract the frequency of each class to obtain c.f distribution.
2. Mark lower class limits along x-axis. 1 cm = 5 units
3. Mark cumulative frequencies along y-axis. 1 cm = 5 units
4. Plot points (x,f) where x is the lower limit of one class and f is the corresponding c.f. (10,188),(20,180),(30,155),(40,117),(50,67)
5. Join the points to get the ogive.
| Marks more than | Frequency | Cumulative Frequency |
| 10 | 8 | 188 |
| 20 | 25 | 180 |
| 30 | 38 | 155 |
| 40 | 50 | 117 |
| 50 | 67 | 67 |
APPEARS IN
संबंधित प्रश्न
The marks obtained by 100 students in a Mathematics test are given below:
| Marks | 0-10 | 10-20 | 20-30 | 30-40 | 40-50 | 50-60 | 60-70 | 70-80 | 80-90 | 90-100 |
| No. of students |
3 | 7 | 12 | 17 | 23 | 14 | 9 | 6 | 5 | 4 |
Draw an ogive for the given distribution on a graph sheet.
Use a scale of 2 cm = 10 units on both axes.
Use the ogive to estimate the:
1) Median.
2) Lower quartile.
3) A number of students who obtained more than 85% marks in the test.
4) A number of students who did not pass in the test if the pass percentage was 35.
The marks scored by 750 students in an examination are given in the form of a frequency distribution table:
| Marks | No. of students |
| 600 - 640 | 16 |
| 640 - 680 | 45 |
| 680 - 720 | 156 |
| 720 - 760 | 284 |
| 760 - 800 | 172 |
| 800 - 840 | 59 |
| 840 - 880 | 18 |
Draw an ogive to represent the following frequency distribution:
| Class-interval: | 0 - 4 | 5 - 9 | 10 - 14 | 15 - 19 | 20 - 24 |
| Frequency: | 2 | 6 | 10 | 5 | 3 |
Draw a cumulative frequency curve (ogive) for the following distributions:
| Class Interval | 10 – 15 | 15 – 20 | 20 – 25 | 25 – 30 | 30 – 35 | 35 – 40 |
| Frequency | 10 | 15 | 17 | 12 | 10 | 8 |
Draw an ogive for the following distributions:
| Marks obtained | less than 10 | less than 20 | less than 30 | less than 40 | less than 50 |
| No. of students | 8 | 25 | 38 | 50 | 67 |
Draw an ogive for the following distributions:
| Age in years (less than) | 10 | 20 | 30 | 40 | 50 | 60 | 70 |
| Cumulative frequency | 0 | 17 | 32 | 37 | 53 | 58 | 65 |
Construct a frequency distribution table for the following distributions:
| Marks (more than) | 0 | 10 | 20 | 30 | 40 | 50 | 60 | 70 | 80 | 90 | 100 |
| Cumulative frequency | 100 | 87 | 65 | 55 | 42 | 36 | 31 | 21 | 18 | 7 | 0 |
The marks obtained by 100 students of a class in an examination are given below.
| Marks | No. of students |
| 0-5 | 2 |
| 5-10 | 5 |
| 10-15 | 6 |
| 15-20 | 8 |
| 20-25 | 10 |
| 25-30 | 25 |
| 30-35 | 20 |
| 35-40 | 18 |
| 40-45 | 4 |
| 45-50 | 2 |
Draw 'a less than' type cumulative frequency curves (orgive). Hence find median
The following is the frequency distribution with unknown frequencies :
| Class | 60-70 | 70-80 | 80-90 | 90-100 | Total |
| frequency | `"a"/2` | `(3"a")/2` | 2a | a | 50 |
Find the value of a, hence find the frequencies. Draw a histogram and frequency polygon on the same coordinate system.
The frequency distribution of scores obtained by 230 candidates in a medical entrance test is as ahead:
| Cost of living Index | Number of Months |
| 400 - 450 | 20 |
| 450 - 500 | 35 |
| 500 - 550 | 40 |
| 550 - 600 | 32 |
| 600 - 650 | 24 |
| 650 - 700 | 27 |
| 700 - 750 | 18 |
| 750 - 800 | 34 |
| Total | 230 |
Draw a cummulative polygon (ogive) to represent the above data.
