Advertisements
Advertisements
प्रश्न
Draw an ogive for the following distributions:
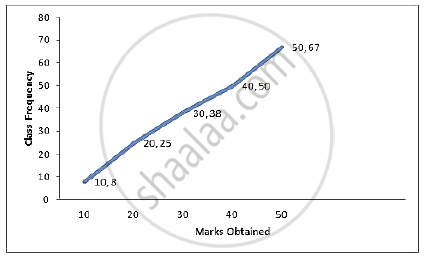
| Marks obtained | less than 10 | less than 20 | less than 30 | less than 40 | less than 50 |
| No. of students | 8 | 25 | 38 | 50 | 67 |
उत्तर
| Marks Obtained | No. of students (c.f.) |
| less than 10 | 8 |
| less than 20 | 25 |
| less than 30 | 38 |
| less than 40 | 50 |
| less than 50 | 67 |
Steps of construction:
- Plot the points (10, 8), (20, 25), (30, 38), (40, 50) and (50, 67) on the graph.
- Join them with free hand to obtain an ogive.
APPEARS IN
संबंधित प्रश्न
The daily wages of 80 workers in a project are given below.
| Wages (in Rs.) |
400-450 | 450-500 | 500-550 | 550-600 | 600-650 | 650-700 | 700-750 |
| No. of workers |
2 | 6 | 12 | 18 | 24 | 13 | 5 |
Use a graph paper to draw an ogive for the above distribution. (Use a scale of 2 cm = Rs. 50 on x-axis and 2 cm = 10 workers on y-axis). Use your ogive to estimate:
- the median wage of the workers.
- the lower quartile wage of workers.
- the numbers of workers who earn more than Rs. 625 daily.
The weight of 50 workers is given below:
| Weight in Kg | 50-60 | 60-70 | 70-80 | 80-90 | 90-100 | 100-110 | 110-120 |
| No. of Workers | 4 | 7 | 11 | 14 | 6 | 5 | 3 |
Draw an ogive of the given distribution using a graph sheet. Take 2 cm = 10 kg on one axis and 2 cm = 5 workers along the other axis. Use a graph to estimate the following:
1) The upper and lower quartiles.
2) If weighing 95 kg and above is considered overweight, find the number of workers who are overweight.
Draw an ogive for the following distributions:
| Age in years (less than) | 10 | 20 | 30 | 40 | 50 | 60 | 70 |
| Cumulative frequency | 0 | 17 | 32 | 37 | 53 | 58 | 65 |
Construct a frequency distribution table for the following distributions:
| Marks (less than) | 0 | 10 | 20 | 30 | 40 | 50 | 60 | 70 | 80 | 90 | 100 |
| Cumulative frequency | 0 | 7 | 28 | 54 | 71 | 84 | 105 | 147 | 180 | 196 | 200 |
Draw an ogive for the following :
| Class Interval | 100-150 | 150-200 | 200-250 | 250-300 | 300-350 | 350-400 |
| Frequency | 10 | 13 | 17 | 12 | 10 | 8 |
Draw an ogive for the following :
| Marks obtained | Less than 10 | Less than 20 | Less than 30 | Less than 40 | Less than 50 |
| No. of students | 8 | 22 | 48 | 60 | 75 |
Draw an ogive for the following :
| Age in years | Less than 10 | Less than 20 | Less than 30 | Less than 40 | Less than 50 |
| No. of people | 0 | 17 | 42 | 67 | 100 |
Prepare the cumulative frequency (less than types) table from the following distribution table :
| Class | 0-10 | 10-20 | 20-30 | 30-40 | 40-50 |
| Frequency | 2 | 3 | 7 | 8 | 5 |
The frequency distribution of scores obtained by 230 candidates in a medical entrance test is as ahead:
| Cost of living Index | Number of Months |
| 400 - 450 | 20 |
| 450 - 500 | 35 |
| 500 - 550 | 40 |
| 550 - 600 | 32 |
| 600 - 650 | 24 |
| 650 - 700 | 27 |
| 700 - 750 | 18 |
| 750 - 800 | 34 |
| Total | 230 |
Draw a cummulative polygon (ogive) to represent the above data.
Cumulative frequency curve is also called ______.
