Advertisements
Advertisements
प्रश्न
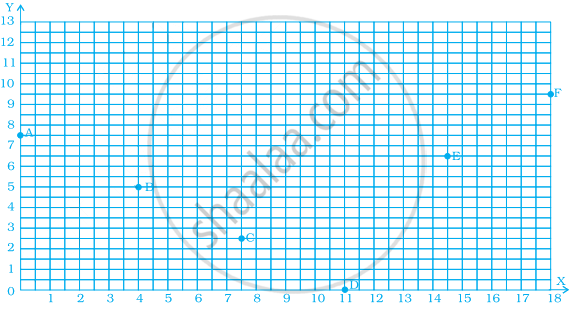
Find the coordinates of all letters in the graph given below.
उत्तर
The point A is on the Y-axis at a distance of 7.5 units from the origin.
∴ The coordinates are (0, 7.5).
The point B is at a distance of 4 units from Y-axis and 5 units from X-axis.
∴ The coordinates of B are (4, 5).
The point C is at a distance of 7.5 units from Y-axis and 2.5 units from X-axis.
∴ The coordinates of C denotes (7.5, 2.5).
The point D lies on X-axis at a distance of 11 units from the origin.
∴ The coordinates of D are (11, 0).
The point E is at a distance of 14.5 units from Y-axis and 6.5 units from X-axis.
∴ The coordinates of E are (14.5, 6.5).
The point F is at a distance of 18 units from Y-axis and 9.5 units from X-axis.
∴ The coordinates of F are (18, 9.5).
APPEARS IN
संबंधित प्रश्न
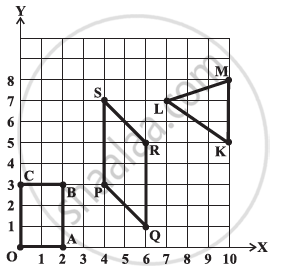
Write the coordinates of the vertices of each of these adjoining figures.
State whether True or False. Correct those are false.
A point whose y coordinate is zero and x-coordinate is 5 will lie on y-axis.
The following table gives the information regarding the number of persons employed to a piece of work and time taken to complete the work:
| Number of persons: | 2 | 4 | 6 | 8 |
| Time taken (in days): | 12 | 6 | 4 | 3 |
Plot a graph of this information.
Write the x-coordinate (abscissa) of the given point.
(0, 5)
Write the y-coordinate (ordinate) of the given point.
(3, 5)
Plot the given points on a graph sheet and check if the points lie on a straight line. If not, name the shape they form when joined in the given order.
(4, 2), (2, 4), (3, 3), (5, 4)
Make a line graph for the area of a square as per the given table.
| Side (in cm) | 1 | 2 | 3 | 4 |
| Area (in cm2) | 1 | 4 | 9 | 16 |
Is it a linear graph?
Study the graph given below of a person who started from his home and returned at the end of the day. Answer the questions that follow.
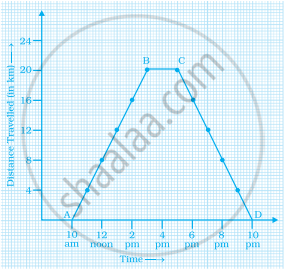
- At what time did the person start from his home?
- How much distance did he travel in the first four hours of his journey?
- What was he doing from 3 pm to 5 pm?
- What was the total distance travelled by him throughout the day?
- Calculate the distance covered by him in the first 8 hours of his journey.
- At what time did he cover 16 km of his journey?
- Calculate the average speed of the man from (a) A to B (b) B to C.
- At what time did he return home?
The table given below shows the temperatures recorded on a day at different times.
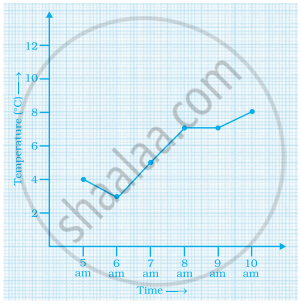
Observe the table and answer the following questions.
- What is the temperature at 8 am?
- At what time is the temperature 3°C?
- During which hour did the temperature fall?
- What is the change in temperature between 7 am and 10 am?
- During which hour was there a constant temperature?
Consider this input/output table.
| Input | 1 | 2 | 4 | 5 | 7 |
| Output | 2 | 5 | 11 | 14 | 20 |
- Graph the values from the table by taking Input along horizontal axis from 0 to 8 and Output along vertical axis from 0 to 24.
- Use your graph to predict the outputs for inputs of 3 and 8.
