Advertisements
Advertisements
प्रश्न
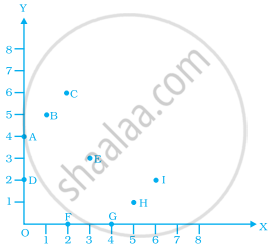
From the given graph, choose the letters that indicate the location of the points given below.

- (2, 0)
- (0, 4)
- (5, 1)
- (2, 6)
- (3, 3)
उत्तर
On observing the graph, we see that the point F is on X-axis, so its Y-coordinate will be zero.
Also, it is at a distance of 2 units from origin.
... The coordinates of F are (2, 0), similarly the coordinates of G are (4, 0).
H is at a distance of 5 units from Y-axis and 1 unit from X-axis.
... The coordinates of H are (5, 1).
D is at a distance of 6 units from Y-axis and 2 units from X-axis.
... The coordinates of D are (6, 2).
The point D and A are on Y-axis at distances of 2 units and 4 units respectively from the origin.
Hence, the coordinates of D and A are (0, 2) and (0, 4), respectively.
B is at a distance of 1 unit from Y-axis and 5 units from X-axis.
... The coordinates of B are (1, 5).
C is at a distance of 2 units from Y-axis and 6 units from X-axis.
... The coordinates of C are (2, 6).
E is at a distance of 3 units from Y-axis and X-axis both.
... The coordinates of E are (3, 3).
APPEARS IN
संबंधित प्रश्न
Find the coordinates of points P, Q, R and S in Fig. 27.8.

The following table shows the amount of rice grown by a farmer in different years:
| Years: | 2000 | 2001 | 2002 | 2003 | 2004 | 2005 | 2006 |
| Rice grown (in quintals): | 200 | 180 | 240 | 260 | 250 | 200 | 270 |
Plot a graph to illustrate this information.
Plot the given points on a graph sheet.
- (5, 4)
- (2, 0)
- (3, 1)
- (0, 4)
- (4, 5)
Find the coordinates of the vertices of the given figures.

Locate the points A(1, 2), B(3, 4) and C(5, 2) on a graph sheet taking suitable axes. Write the coordinates of the fourth point D to complete the rhombus ABCD. Measure the diagonals of this rhombus and find whether they are equal or not.
The following is the time-distance graph of Sneha’s walking.

- When does Sneha make the least progress? Explain your reasoning.
- Find her average speed in km/hour.
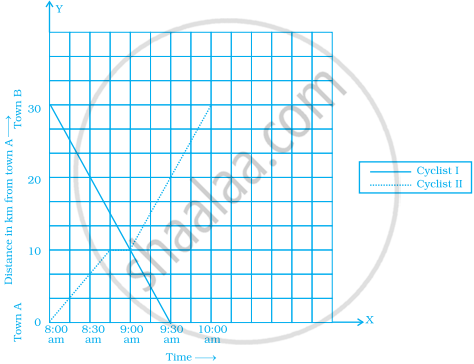
The following graph shows the journey made by two cyclists, one from town A to B and the other from town B to A.
- At what time did cyclist II rest? How long did the cyclist rest?
- Was cyclist II cycling faster or slower after the rest?
- At what time did the two cyclists meet?
- How far had cyclist II travelled when he met cyclist I?
- When cyclist II reached town A, how far was cyclist I from town B?

Draw the line graph using suitable scale to show the annual gross profit of a company for a period of five years.
| Year | 1st | 2nd | 3rd | 4th | 5th |
| Gross Profit (in Rs) |
17,00,000 | 15,50,000 | 11,40,000 | 12,10,000 | 14,90,000 |
The table shows the data collected for Dhruv’s walking on a road.
| Time (in minutes) |
0 | 5 | 10 | 15 | 20 | 25 |
| Distance (in km) |
0 | 0.5 | 1 | 1.25 | 1.5 | 1.75 |
- Plot a line graph for the given data using a suitable scale.
- In what time periods did Dhruv make the most progress?
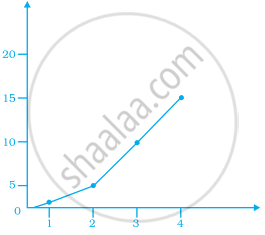
Observe the given graph carefully and complete the table given below.
| x | 1 | 2 | 3 | 4 | 5 |
| y |

