Advertisements
Advertisements
प्रश्न
The following is the time-distance graph of Sneha’s walking.

- When does Sneha make the least progress? Explain your reasoning.
- Find her average speed in km/hour.
उत्तर
a. Sneha made least progress between 25 min to 40 min.
Observing the graph carefully, we see that initially, she is travelling approximately 0.5 km in 10 min, 0.25 km in 5 min, till the first 25 min. But after 25 min, her speed decreased as she travelled 0.25 km in 15 min (between 25 min to 40 min).
b. Average speed = `"Total distance travelled"/"TIme"`
= `2/(55/60)`
= `2/55 xx 60`
= 2.18 km/h
APPEARS IN
संबंधित प्रश्न
Locate the points:
(2, 1), (2, 2), (2, 3), (2, 4)
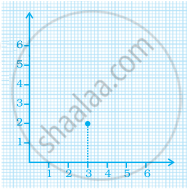
In the given graph the coordinates of point x are ______.

The point (3, 4) is at a distance of ______.
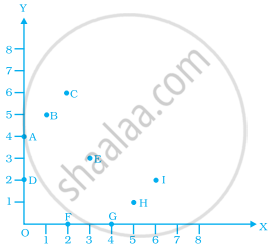
From the given graph, choose the letters that indicate the location of the points given below.

- (2, 0)
- (0, 4)
- (5, 1)
- (2, 6)
- (3, 3)
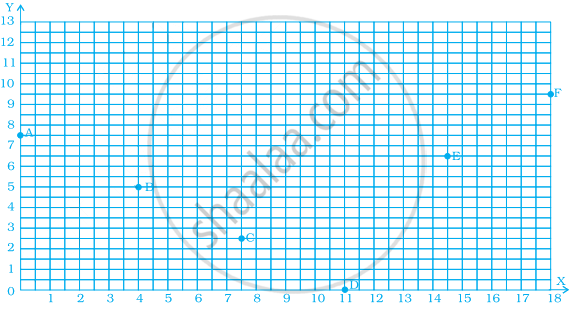
Find the coordinates of all letters in the graph given below.

Write the x-coordinate (abscissa) of the given point.
(5, 7)
If y-coordinate is 3 times x-coordinate, form a table for it and draw a graph.
Find the coordinates of the vertices of the given figures.

Draw the line graph using suitable scale to show the annual gross profit of a company for a period of five years.
| Year | 1st | 2nd | 3rd | 4th | 5th |
| Gross Profit (in Rs) |
17,00,000 | 15,50,000 | 11,40,000 | 12,10,000 | 14,90,000 |
Observe the toothpick pattern given below:
(a) Imagine that this pattern continues. Complete the table to show the number of toothpicks in the first six terms.
| Pattern | 1 | 2 | 3 | 4 | 5 | 6 |
| Toothpicks | 4 | 13 |
(b) Make a graph by taking the pattern numbers on the horizontal axis and the number of toothpicks on the vertical axis. Make the horizontal axis from 0 to 10 and the vertical axis from 0 to 30.
(c) Use your graph to predict the number of toothpicks in patterns 7 and 8. Check your answers by actually drawing them.
(d) Would it make sense to join the points on this graph? Explain.
