Advertisements
Advertisements
Question
The following is the time-distance graph of Sneha’s walking.

- When does Sneha make the least progress? Explain your reasoning.
- Find her average speed in km/hour.
Solution
a. Sneha made least progress between 25 min to 40 min.
Observing the graph carefully, we see that initially, she is travelling approximately 0.5 km in 10 min, 0.25 km in 5 min, till the first 25 min. But after 25 min, her speed decreased as she travelled 0.25 km in 15 min (between 25 min to 40 min).
b. Average speed = `"Total distance travelled"/"TIme"`
= `2/(55/60)`
= `2/55 xx 60`
= 2.18 km/h
APPEARS IN
RELATED QUESTIONS
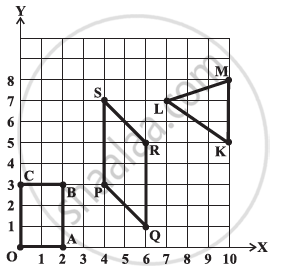
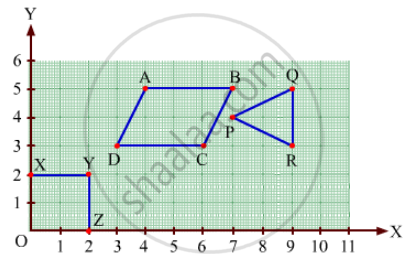
Write the coordinates of the vertices of each of these adjoining figures.
State whether True or False. Correct those are false.
A point whose y coordinate is zero and x-coordinate is 5 will lie on y-axis.
State whether True or False. Correct those are false.
The coordinates of the origin are (0, 0).
Plot the points (5, 0), (5, 1), (5, 8). Do they lie on a line? What is your observation?
Write the coordinates of each of the vertices of each polygon in Fig. 27.9.
Write the x-coordinate (abscissa) of the given point.
(5, 7)
Write the y-coordinate (ordinate) of the given point.
(3, 5)
The graph given below compares the sales of ice creams of two vendors for a week.

Observe the graph and answer the following questions.
- Which vendor has sold more icecreams on Friday?
- For which day was the sales same for both the vendors?
- On which day did the sale of vendor A increase the most as compared to the previous day?
- On which day was the difference in sales the maximum?
- On which two days was the sales same for vendor B?
The table given below shows the temperatures recorded on a day at different times.
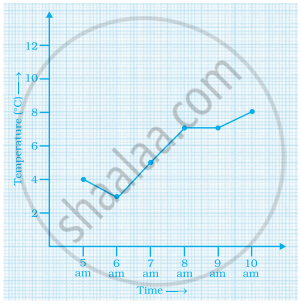
Observe the table and answer the following questions.
- What is the temperature at 8 am?
- At what time is the temperature 3°C?
- During which hour did the temperature fall?
- What is the change in temperature between 7 am and 10 am?
- During which hour was there a constant temperature?
This graph shows the per cent of students who dropped out of school after completing High School. The point labelled A shows that, in 1996, about 4.7% of students dropped out.
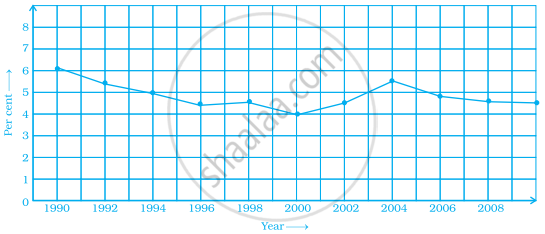
- In which year was the dropout the rate highest? In which year was it the lowest?
- When did the per cent of students who dropped out of high school first fall below 5%?
- About what per cent of students dropped out of high school in 2007? About what per cent of students stayed in high school in 2008?
