Advertisements
Chapters
2: Data Handling
3: Square-Square Root and Cube-Cube Root
4: Linear Equation In One Variable
5: Understanding Quadrilaterals and Practical Geometry
6: Visualising Solid Shapes
7: Algebraic Expression, Identities and Factorisation
8: Exponents and Powers
9: Comparing Quantities
10: Direct and Inverse Proportions
11: Mensuration
▶ 12: Introduct To Graphs
13: Playing With Numbers
![NCERT Exemplar solutions for Mathematics [English] Class 8 chapter 12 - Introduct To Graphs - Shaalaa.com](/images/mathematics-english-class-8_6:5f2b1b2038084cf381bfa42c826a928c.jpg "NCERT Exemplar solutions for Mathematics [English] Class 8 chapter 12 - Introduct To Graphs")
Advertisements
Solutions for Chapter 12: Introduct To Graphs
Below listed, you can find solutions for Chapter 12 of CBSE NCERT Exemplar for Mathematics [English] Class 8.
NCERT Exemplar solutions for Mathematics [English] Class 8 12 Introduct To Graphs Exercise [Pages 372 - 398]
Choose the correct alternative:
Comparison of parts of a whole may be done by a ______.
bar graph
pie chart
linear graph
line graph
A graph that displays data that changes continuously over periods of time is ______.
bar graph
pie chart
histogram
line graph
In the given graph the coordinates of point x are ______.
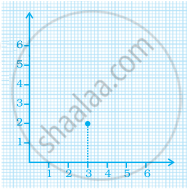
(0, 2)
(2, 3)
(3, 2)
(3, 0)
In the given graph the letter that indicates the point (0, 3) is ______.

P
Q
R
S
The point (3, 4) is at a distance of ______.
3 from both the axis
4 from both the axis
4 from the x-axis and 3 from y-axis
3 from x-axis and from y-axis
A point which lies on both the axis is ______.
(0, 0)
(0, 1)
(1, 0)
(1, 1)
The coordinates of a point at a distance of 3 units from the x axis and 6 units from the y axis is ______.
(0, 3)
(6, 0)
(3, 6)
(6, 3)
In the given figure the position of the book on the table may be given by ______.
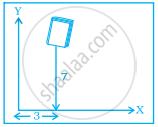
(7, 3)
(3, 7)
(3, 3)
(7, 7)
Data was collected on a student’s typing rate and graph was drawn as shown below. Approximately how many words had this student typed in 30 seconds?

20
24
28
34
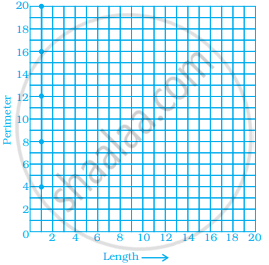
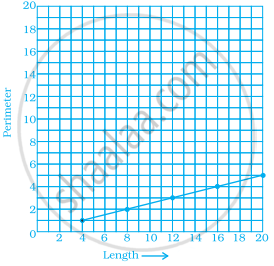
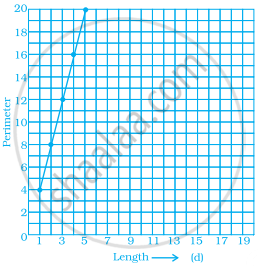
Which graphs of the following represent the table below?
| Length of Side of a Square | 1 | 2 | 3 | 4 | 5 |
| Perimeter | 4 | 8 | 12 | 16 | 20 |

Fill in the blanks:
______ displays data that changes continuously over periods of time.
The relation between dependent and independent variables is shown through a ______.
We need ______ coordinates for representing a point on the graph sheet.
A point in which the x-coordinate is zero and y-coordinate is non-zero will lie on the ______.
The horizontal and vertical line in a line graph are usually called ______ and ______.
The process of fixing a point with the help of the coordinates is known as ______ of the point.
The distance of any point from the y-axis is the ______ coordinate.
All points with y-coordinate as zero lie on the ______.
For the point (5, 2), the distance from the x-axis is ______ units.
The x-coordinate of any point lying on the y-axis will be ______.
The y-coordinate of the point (2, 4) is ______.
In the point (4, 7), 4 denotes the ______.
A point has 5 as its x–coordinate and 4 as its y–coordinate. Then the coordinates of the point are given by ______.
In the coordinates of a point, the second number denotes the ______.
The point where the two axes intersect is called the ______.
State whether the following statement is True or False:
For fixing a point on the graph sheet we need two coordinates.
True
False
A line graph can also be a whole unbroken line.
True
False
The distance of any point from the x-axis is called the x-coordinate.
True
False
The distance of the point (3, 5) from the y-axis is 5.
True
False
The ordinate of a point is its distance from the y-axis.
True
False
In the point (2, 3), 3 denotes the y-coordinate.
True
False
The coordinates of the origin are (0, 0).
True
False
The points (3, 5) and (5, 3) represent the same point.
True
False
The y-coordinate of any point lying on the x-axis will be zero.
True
False
Match the coordinates given in Column A with the items mentioned in Column B.
| Column A | Column B |
| (1) (0, 5) | (a) y coordinate is 2 × x - coordinate + 1. |
| (2) (2, 3) | (b) Coordinates of origin. |
| (3) (4, 8) | (c) Only y–coordinate is zero. |
| (4) (3, 7) | (d) The distance from x-axis is 5. |
| (5) (0, 0) | (e) y coordinate is double of x-coordinate. |
| (6) (5, 0) | (f) The distance from y-axis is 2. |
Match the ordinates of the points given in Column A with the items mentioned in Column B.
| Column A | Column B |
| (a) (7, 0) | (i) The ordinate is double the abscissa. |
| (b) (11, 11) | (ii) The ordinate is zero. |
| (c) (4, 8) | (iii) The ordinate is equal to the abscissa. |
| (d) (6, 2) | (iv) The abscissa is double the ordinate. |
| (e) (0, 9) | (v) The abscissa is triple the ordinate. |
| (f) (6, 3) | (vi) The abscissa is zero. |
From the given graph, choose the letters that indicate the location of the points given below.
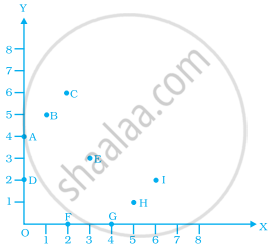
- (2, 0)
- (0, 4)
- (5, 1)
- (2, 6)
- (3, 3)
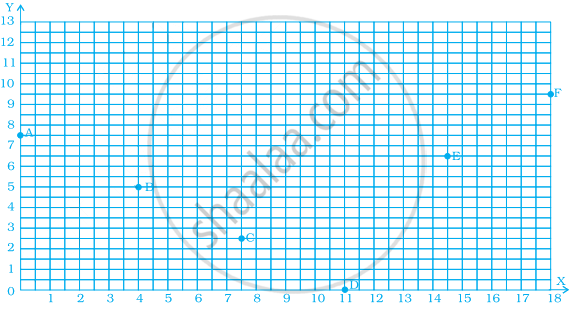
Find the coordinates of all letters in the graph given below.
Plot the given points on a graph sheet.
- (5, 4)
- (2, 0)
- (3, 1)
- (0, 4)
- (4, 5)
Study the given map of a zoo and answer the following questions.
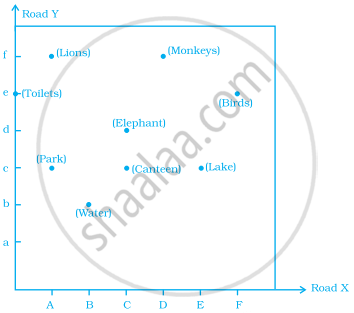
- Give the location of lions in the zoo.
- (D, f) and (C, d) represent locations of which animals in the zoo?
- Where are the toilets located?
- Give the location of canteen.
Write the x-coordinate (abscissa) of the given point.
(7, 3)
Write the x-coordinate (abscissa) of the given point.
(5, 7)
Write the x-coordinate (abscissa) of the given point.
(0, 5)
Write the y-coordinate (ordinate) of the given point.
(3, 5)
Write the y-coordinate (ordinate) of the given point.
(4, 0)
Write the y-coordinate (ordinate) of the given point.
(2, 7)
Plot the given points on a graph sheet and check if the points lie on a straight line. If not, name the shape they form when joined in the given order.
(1, 2), (2, 4), (3, 6), (4, 8)
Plot the given points on a graph sheet and check if the points lie on a straight line. If not, name the shape they form when joined in the given order
(1, 1), (1, 2), (2, 1), (2, 2)
Plot the given points on a graph sheet and check if the points lie on a straight line. If not, name the shape they form when joined in the given order.
(4, 2), (2, 4), (3, 3), (5, 4)
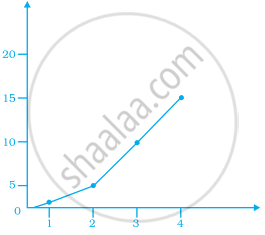
If y-coordinate is 3 times x-coordinate, form a table for it and draw a graph.
Make a line graph for the area of a square as per the given table.
| Side (in cm) | 1 | 2 | 3 | 4 |
| Area (in cm2) | 1 | 4 | 9 | 16 |
Is it a linear graph?
The cost of a note book is Rs 10. Draw a graph after making a table showing cost of 2, 3, 4, .... note books. Use it to find
- the cost of 7 notebooks.
- the number of note books that can be purchased with Rs 50.
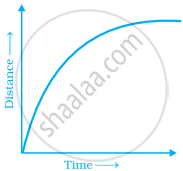
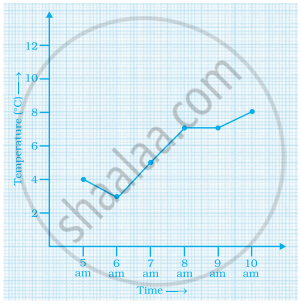
Explain the situations represented by the following distance-time graph.
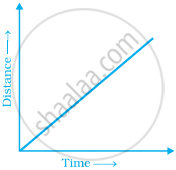
Explain the situations represented by the following distance-time graph.
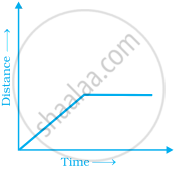
Explain the situations represented by the following distance-time graph.
Complete the given table and draw a graph.
| x | 0 | 1 | 2 | 3 |
| y = 3x + 1 | 1 | 4 | - | - |
Complete the given table and draw a graph.
| x | 1 | 2 | 4 | 6 |
| y = x – 1 | 0 | - | - | - |
Study the given graph and complete the corresponding table below.

Study the given graph and complete the corresponding table below.

Draw a graph for the radius and circumference of circle using a suitable scale.
(Hint: Take radius = 7, 14, 21 units and so on)
From the graph,
- Find the circumference of the circle when radius is 42 units.
- At what radius will the circumference of the circle be 220 units?
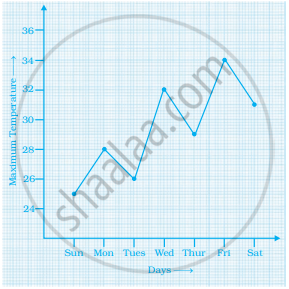
The graph shows the maximum temperatures recorded for two consecutive weeks of a town. Study the graph and answer the questions that follow.

- What information is given by the two axes?
- In which week was the temperature higher on most of the days?
- On which day was the temperature same in both the weeks?
- On which day was the difference in temperatures the maximum for both the weeks?
- What were the temperatures for both the weeks on Thursday?
- On which day was the temperature 35°C for the first week?
- On which day was the temperature highest for the second week?
The graph given below gives the actual and expected sales of cars of a company for 6 months. Study the graph and answer the questions that follow.
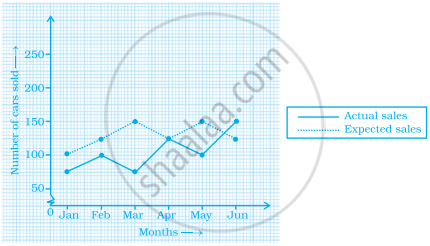
- In which month was the actual sales same as the expected sales?
- For which month(s) was (were) the difference in actual and expected sales the maximum?
- For which month(s) was (were) the difference in actual and expected sales the least?
- What was the total sales of cars in the months–Jan, Feb. and March?
- What is the average sales of cars in the last three months?
- Find the ratio of sales in the first three months to the last three months
The graph given below shows the marks obtained out of 10 by Sonia in two different tests. Study the graph and answer the questions that follow.
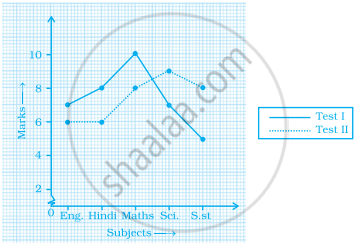
- What information is represented by the axes?
- In which subject did she score the highest in Test I?
- In which subject did she score the least in Test II?
- In which subject did she score the same marks in both the Tests?
- What are the marks scored by her in English in Test II?
- In which test was the performance better?
- In which subject and which test did she score full marks?
Find the coordinates of the vertices of the given figures.

Study the graph given below of a person who started from his home and returned at the end of the day. Answer the questions that follow.
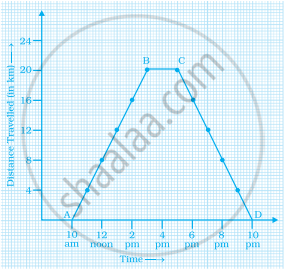
- At what time did the person start from his home?
- How much distance did he travel in the first four hours of his journey?
- What was he doing from 3 pm to 5 pm?
- What was the total distance travelled by him throughout the day?
- Calculate the distance covered by him in the first 8 hours of his journey.
- At what time did he cover 16 km of his journey?
- Calculate the average speed of the man from (a) A to B (b) B to C.
- At what time did he return home?
Plot a line graph for the variables p and q where p is two times q i.e, the equation is p = 2q. Then find.
- the value of p when q = 3
- the value of q when p = 8
Study the graph and answer the questions that follow.
- What information does the graph give?
- On which day was the temperature the least?
- On which day was the temperature 31°C?
- Which was the hottest day?
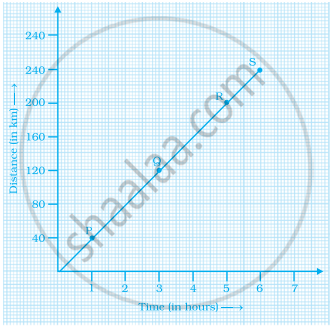
Study the distance-time graph given below for a car to travel to certain places and answer the questions that follow.
- How far does the car travel in 2 hours?
- How much time does the car take to reach R?
- How long does the car take to cover 80 km?
- How far is Q from the starting point?
- When does the car reach the place S after starting?
Locate the points A(1, 2), B(4, 2) and C(1, 4) on a graph sheet taking suitable axes. Write the coordinates of the fourth point D to complete the rectangle ABCD.
Locate the points A(1, 2), B(3, 4) and C(5, 2) on a graph sheet taking suitable axes. Write the coordinates of the fourth point D to complete the rhombus ABCD. Measure the diagonals of this rhombus and find whether they are equal or not.
Locate the points P(3, 4), Q(1, 0), R(0, 4), S(4, 1) on a graph sheet and write the coordinates of the point of intersection of line segments PQ and RS.
The graph given below compares the sales of ice creams of two vendors for a week.

Observe the graph and answer the following questions.
- Which vendor has sold more icecreams on Friday?
- For which day was the sales same for both the vendors?
- On which day did the sale of vendor A increase the most as compared to the previous day?
- On which day was the difference in sales the maximum?
- On which two days was the sales same for vendor B?
The table given below shows the temperatures recorded on a day at different times.
Observe the table and answer the following questions.
- What is the temperature at 8 am?
- At what time is the temperature 3°C?
- During which hour did the temperature fall?
- What is the change in temperature between 7 am and 10 am?
- During which hour was there a constant temperature?
The following table gives the growth chart of a child.
| Height (in cm) | 75 | 90 | 110 | 120 | 130 |
| Age (in years) | 2 | 4 | 6 | 8 | 10 |
Draw a line graph for the table and answer the questions that follow.
- What is the height at the age of 5 years?
- How much taller was the child at the age of 10 than at the age of 6?
- Between which two consecutive periods did the child grow more faster?
The following is the time-distance graph of Sneha’s walking.

- When does Sneha make the least progress? Explain your reasoning.
- Find her average speed in km/hour.
Draw a parallelogram ABCD on a graph paper with the coordinates given in Table I. Use this table to complete Tables II and III to get the coordinates of E, F, G, H and J, K, L, M.
| Point | (x, y) |
| A | (1, 1) |
| B | (4. 4) |
| C | (8, 4) |
| D | (5, 1) |
Table I
| Point | (0.5x, 0.5y) |
| E | (0.5, 0.5) |
| F | |
| G | |
| H |
Table II
| Point | (2x, 1.5y) |
| J | (2, 1.5) |
| K | |
| L | |
| M |
Table III
Draw parallelograms EFGH and JKLM on the same graph paper.
Plot the points (2, 4) and (4, 2) on a graph paper, then draw a line segment joining these two points.
Extend the line segment on both sides to meet the coordinate axes. What are the coordinates of the points where this line meets the x-axis and the y-axis?
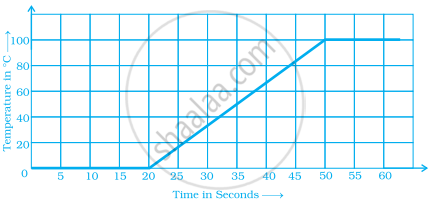
The following graph shows the change in temperature of a block of ice when heated. Use the graph to answer the following questions:
- For how many seconds did the ice block have no change in temperature?
- For how long was there a change in temperature?
- After how many seconds of heating did the temperature become constant at 0°C?
- What was the temperature after 25 seconds?
- What will be the temperature after 1.5 minutes? Justify your answer.
The following graph shows the number of people present at a certain shop at different times. Observe the graph and answer the following questions.
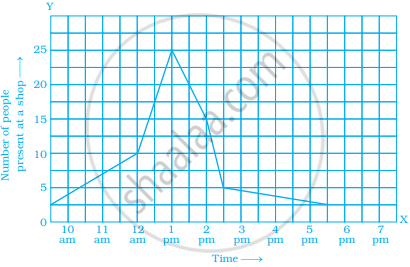
- What type of a graph is this?
- What information does the graph give?
- What is the busiest time of day at the shop?
- How many people enter the shop when it opens?
- About how many people are there in the shop at 1:30 pm?
A man started his journey on his car from location A and came back. The given graph shows his position at different times during the whole journey.
- At what time did he start and end his journey?
- What was the total duration of journey?
- Which journey, forward or return, was of longer duration?
- For how many hours did he not move?
- At what time did he have the fastest speed?

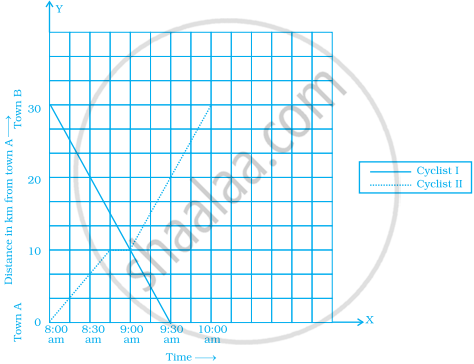
The following graph shows the journey made by two cyclists, one from town A to B and the other from town B to A.
- At what time did cyclist II rest? How long did the cyclist rest?
- Was cyclist II cycling faster or slower after the rest?
- At what time did the two cyclists meet?
- How far had cyclist II travelled when he met cyclist I?
- When cyclist II reached town A, how far was cyclist I from town B?
Ajita starts off from home at 07.00 hours with her father on a scooter that goes at a uniform speed of 30 km/h and drops her at her school after half an hour. She stays in the school till 13.30 hours and takes an auto-rickshaw to return home. The rickshaw has a uniform speed of 10 km/h. Draw the graph for the above situation and also determine the distance of Ajita’s school from her house.
Draw the line graph using suitable scale to show the annual gross profit of a company for a period of five years.
| Year | 1st | 2nd | 3rd | 4th | 5th |
| Gross Profit (in Rs) |
17,00,000 | 15,50,000 | 11,40,000 | 12,10,000 | 14,90,000 |
The following chart gives the growth in height in terms of percentage of full height of boys and girls with their respective ages.
| Age (in years) | 8 | 9 | 10 | 11 | 12 | 13 | 14 | 15 | 16 | 17 |
18 |
| Boys | 72% | 75% | 78% | 81% | 84% | 88% | 92% | 95% | 98% | 99% | 100% |
| Girls | 77% | 81% | 84% | 88% | 91% | 95% | 98% | 99% | 99.5% | 100% | 100% |
Draw the line graph of above data on the same sheet and answer the following questions.
- In which year both the boys and the girls achieve their maximum height?
- Who grows faster at puberty (14 years to 16 years of age)?
The table shows the data collected for Dhruv’s walking on a road.
| Time (in minutes) |
0 | 5 | 10 | 15 | 20 | 25 |
| Distance (in km) |
0 | 0.5 | 1 | 1.25 | 1.5 | 1.75 |
- Plot a line graph for the given data using a suitable scale.
- In what time periods did Dhruv make the most progress?
Observe the given graph carefully and complete the table given below.
| x | 1 | 2 | 3 | 4 | 5 |
| y |
This graph shows the per cent of students who dropped out of school after completing High School. The point labelled A shows that, in 1996, about 4.7% of students dropped out.
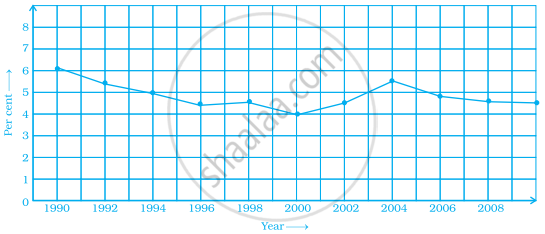
- In which year was the dropout the rate highest? In which year was it the lowest?
- When did the per cent of students who dropped out of high school first fall below 5%?
- About what per cent of students dropped out of high school in 2007? About what per cent of students stayed in high school in 2008?
Observe the toothpick pattern given below: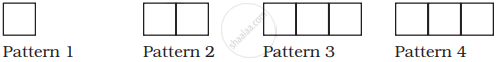
(a) Imagine that this pattern continues. Complete the table to show the number of toothpicks in the first six terms.
| Pattern | 1 | 2 | 3 | 4 | 5 | 6 |
| Toothpicks | 4 | 13 |
(b) Make a graph by taking the pattern numbers on the horizontal axis and the number of toothpicks on the vertical axis. Make the horizontal axis from 0 to 10 and the vertical axis from 0 to 30.
(c) Use your graph to predict the number of toothpicks in patterns 7 and 8. Check your answers by actually drawing them.
(d) Would it make sense to join the points on this graph? Explain.
Consider this input/output table.
| Input | 1 | 2 | 4 | 5 | 7 |
| Output | 2 | 5 | 11 | 14 | 20 |
- Graph the values from the table by taking Input along horizontal axis from 0 to 8 and Output along vertical axis from 0 to 24.
- Use your graph to predict the outputs for inputs of 3 and 8.
This graph shows a map of an island just off the coast of a continent. The point labelled B represents a major city on the coast. The distance between grid lines represents 1 km.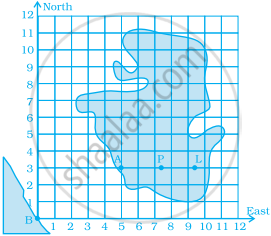
Point A represents a resort that is located 5 km East and 3 km North of Point B. The values 5 and 3 are the coordinates of Point A. The coordinates can be given as the ordered pair (5, 3), where 5 is the horizontal coordinate and 3 is the vertical coordinate.
(i) On a copy of the map, mark the point that is 3 km East and 5 km North of Point B and label it S. Is Point S in the water or on the island? Is Point S in the same place as Point A?
(ii) Mark the point that is 7 km east and 5 km north of Point B and label it C. Then mark the point that is 5 km east and 7 km north of Point B and label it D. Are Points C and D in the same place? Give the coordinates of Points C and D.
(iii) Which point is in the water, (2, 7) or (7, 2)? Mark the point which is in water on your map and label it E.
(iv) Give the coordinates of two points on the island that are exactly 2 km from Point A.
(v) Give the coordinates of the point that is halfway between Points L and P.
(vi) List three points on the island with their x-coordinates greater than 8.
(vii) List three points on the island with a y-coordinate less than 4.
As part of his science project, Prithvi was supposed to record the temperature every hour one Saturday from 6 am to midnight. At noon, he was taking lunch and forgot to record the temperature. At 8:00 pm, his favourite show came on and so forgot again. He recorded the data so collected on a graph sheet as shown below.
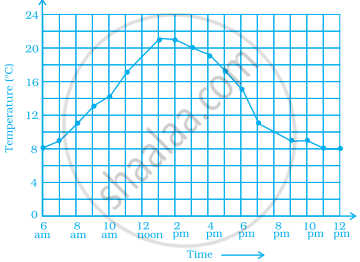
- Why does it make sense to connect the points in this situation?
- Describe the overall trend, or pattern, in the way the temperature changes over the time period shown on the graph.
- Estimate the temperature at noon and 8 pm.
The graph given below compares the price (in Rs) and weight of 6 bags (in kg) of sugar of different brands A, B, C, D, E, F.
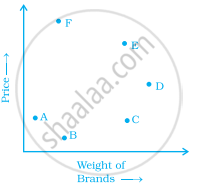
- Which brand(s) costs/cost more than Brand D?
- Bag of which brand of sugar is the heaviest?
- Which brands weigh the same?
- Which brands are heavier than brand B?
- Which bag is the lightest?
- Which bags are of the same price?
The points on the graph below represent the height and weight of the donkey, dog, crocodile, and ostrich shown in the drawing.
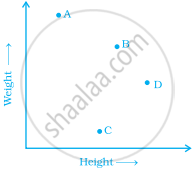
- What are the two variables represented in the graph?
- Which point represents each animals? Explain.
The two graphs below compare Car A and Car B. The left graph shows the relationship between age and value. The right graph shows the relationship between size and maximum speed.
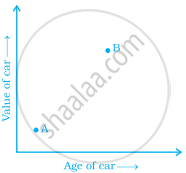 |
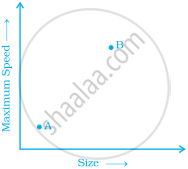 |
Use the graphs to determine whether each statement is true or false, and explain your answer.
- The older car is less valuable.
- The faster car is larger.
- The larger car is older.
- The faster car is older.
- The more valuable car is slower.
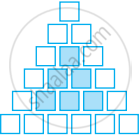
Sonal and Anmol made a sequence of tile designs from square white tiles surrounding one square purple tile. The purple tiles come in many sizes. Three of the designs are shown below.
(a) Copy and complete the table
| Side Length of Purple Titles | 1 | 2 | 3 | 4 | 5 | 10 | 100 |
| Number of white Tiles in Border |
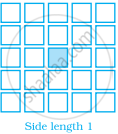 |
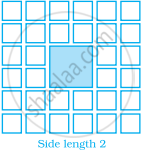 |
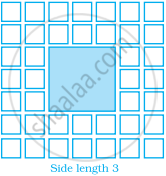 |
(b) Draw a graph using the first five pairs of numbers in your table.
(c) Do the points lie on a line?
Sonal and Anmol then made another sequence of the designs. Three of the designs are shown below.
 |
 |
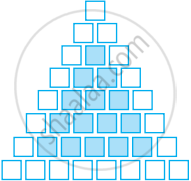 |
(a) Complete the table.
| Rows, r | 4 | 6 | 8 |
| Number of white Tiles, w | 9 | ||
| Number of Purple Tiles, p | 1 |
(b) Draw a graph of rows and number of white tiles. Draw another graph of the number of rows and the number of purple tiles. Put the number of rows on the horizontal axis.
(c) Which graph is linear?
Solutions for 12: Introduct To Graphs
NCERT Exemplar solutions for Mathematics [English] Class 8 chapter 12 - Introduct To Graphs
Shaalaa.com has the CBSE Mathematics Mathematics [English] Class 8 CBSE solutions in a manner that help students grasp basic concepts better and faster. The detailed, step-by-step solutions will help you understand the concepts better and clarify any confusion. NCERT Exemplar solutions for Mathematics Mathematics [English] Class 8 CBSE 12 (Introduct To Graphs) include all questions with answers and detailed explanations. This will clear students' doubts about questions and improve their application skills while preparing for board exams.
Further, we at Shaalaa.com provide such solutions so students can prepare for written exams. NCERT Exemplar textbook solutions can be a core help for self-study and provide excellent self-help guidance for students.
Concepts covered in Mathematics [English] Class 8 chapter 12 Introduct To Graphs are Concept of Bar Graph, Concept of Pie Graph (Or a Circle-graph), Graphical Representation of Data as Histograms, Concept of a Line Graph, Linear Graphs, Interpretation of Bar Graphs, Drawing a Bar Graph, Concept of Double Bar Graph, Interpretation of a Double Bar Graph, Drawing a Double Bar Graph, Some Application of Linear Graphs.
Using NCERT Exemplar Mathematics [English] Class 8 solutions Introduct To Graphs exercise by students is an easy way to prepare for the exams, as they involve solutions arranged chapter-wise and also page-wise. The questions involved in NCERT Exemplar Solutions are essential questions that can be asked in the final exam. Maximum CBSE Mathematics [English] Class 8 students prefer NCERT Exemplar Textbook Solutions to score more in exams.
Get the free view of Chapter 12, Introduct To Graphs Mathematics [English] Class 8 additional questions for Mathematics Mathematics [English] Class 8 CBSE, and you can use Shaalaa.com to keep it handy for your exam preparation.
