Advertisements
Advertisements
Question
A man started his journey on his car from location A and came back. The given graph shows his position at different times during the whole journey.
- At what time did he start and end his journey?
- What was the total duration of journey?
- Which journey, forward or return, was of longer duration?
- For how many hours did he not move?
- At what time did he have the fastest speed?

Solution
Analysing the graph carefully, we observe that
- He started his journey at 5:30 AM and end at 6 PM.
- Total duration of journey was 12:30 h.
- His forward journey is of duration 8:30 h and return journey is of duration 4 h. Forward journey was of longer duration.
- He did not move from 6:30 AM to 9:30 AM and 10 AM to 1 PM. So, he did not move for 6 h.
- He have the fastest speed at 1 PM.
APPEARS IN
RELATED QUESTIONS
Decide which of the following statements is true and which is false. Give reasons for your answer.
A point whose y-coordinate is zero, will lie on x-axis.
In the given graph the letter that indicates the point (0, 3) is ______.

The point (3, 4) is at a distance of ______.
A point which lies on both the axis is ______.
In the point (4, 7), 4 denotes the ______.
Write the y-coordinate (ordinate) of the given point.
(3, 5)
The following table gives the growth chart of a child.
| Height (in cm) | 75 | 90 | 110 | 120 | 130 |
| Age (in years) | 2 | 4 | 6 | 8 | 10 |
Draw a line graph for the table and answer the questions that follow.
- What is the height at the age of 5 years?
- How much taller was the child at the age of 10 than at the age of 6?
- Between which two consecutive periods did the child grow more faster?
This graph shows a map of an island just off the coast of a continent. The point labelled B represents a major city on the coast. The distance between grid lines represents 1 km.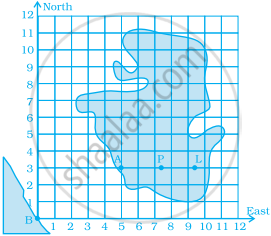
Point A represents a resort that is located 5 km East and 3 km North of Point B. The values 5 and 3 are the coordinates of Point A. The coordinates can be given as the ordered pair (5, 3), where 5 is the horizontal coordinate and 3 is the vertical coordinate.
(i) On a copy of the map, mark the point that is 3 km East and 5 km North of Point B and label it S. Is Point S in the water or on the island? Is Point S in the same place as Point A?
(ii) Mark the point that is 7 km east and 5 km north of Point B and label it C. Then mark the point that is 5 km east and 7 km north of Point B and label it D. Are Points C and D in the same place? Give the coordinates of Points C and D.
(iii) Which point is in the water, (2, 7) or (7, 2)? Mark the point which is in water on your map and label it E.
(iv) Give the coordinates of two points on the island that are exactly 2 km from Point A.
(v) Give the coordinates of the point that is halfway between Points L and P.
(vi) List three points on the island with their x-coordinates greater than 8.
(vii) List three points on the island with a y-coordinate less than 4.
The points on the graph below represent the height and weight of the donkey, dog, crocodile, and ostrich shown in the drawing.
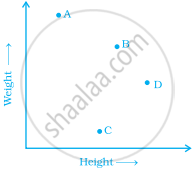
- What are the two variables represented in the graph?
- Which point represents each animals? Explain.
