Advertisements
Advertisements
Question
The points on the graph below represent the height and weight of the donkey, dog, crocodile, and ostrich shown in the drawing.
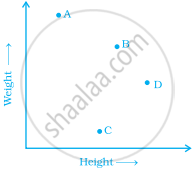
- What are the two variables represented in the graph?
- Which point represents each animals? Explain.
Solution
a. Height and weight are the two variables in the graph.
b. In the graph, we observe that the points A represents a crocodile as it has least height and greatest weight among all animals.
A – Crocodile ...[Least height, Greatest weight]
B – Donkey ...[Height and Weight more than dog]
C – Dog
D – Ostrich ...[Greatest height]
APPEARS IN
RELATED QUESTIONS
Draw the line passing through (2, 3) and (3, 2). Find the coordinates of the points at which this line meets the x-axis and y-axis.
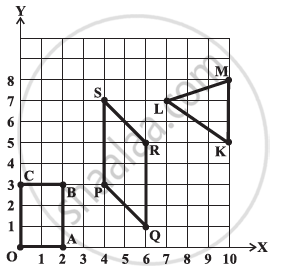
Write the coordinates of the vertices of each of these adjoining figures.
The following table gives the information regarding length of a side of a square and its area:
| Length of a side (in cm): | 1 | 2 | 3 | 4 | 5 |
| Area of square (in cm2): | 1 | 4 | 9 | 16 | 25 |
Draw a graph to illustrate this information.
We need ______ coordinates for representing a point on the graph sheet.
The x-coordinate of any point lying on the y-axis will be ______.
For fixing a point on the graph sheet we need two coordinates.
The distance of any point from the x-axis is called the x-coordinate.
The y-coordinate of any point lying on the x-axis will be zero.
Plot the given points on a graph sheet.
- (5, 4)
- (2, 0)
- (3, 1)
- (0, 4)
- (4, 5)
The following table gives the growth chart of a child.
| Height (in cm) | 75 | 90 | 110 | 120 | 130 |
| Age (in years) | 2 | 4 | 6 | 8 | 10 |
Draw a line graph for the table and answer the questions that follow.
- What is the height at the age of 5 years?
- How much taller was the child at the age of 10 than at the age of 6?
- Between which two consecutive periods did the child grow more faster?
