Advertisements
Advertisements
Question
The following table gives the information regarding length of a side of a square and its area:
| Length of a side (in cm): | 1 | 2 | 3 | 4 | 5 |
| Area of square (in cm2): | 1 | 4 | 9 | 16 | 25 |
Draw a graph to illustrate this information.
Solution
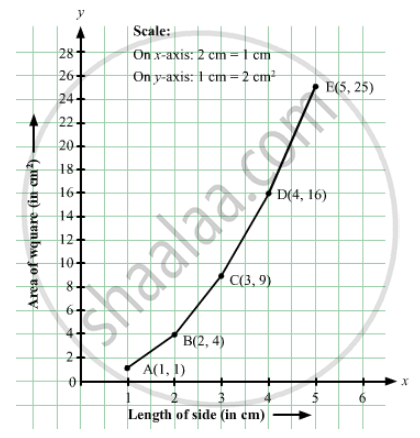
Here, length of a side is an independent variable and area of square is a dependent variable. So, we take length of a side on the x-axis and area of square on the y-axis.
Let us choose the following scale:
On x-axis: 2 cm = 1 cm
On y-axis: 1 cm = 2 cm2
Now we plot (1,1), (2,4), (3,9), (4,16), (5,25). These points are joined to get the graph representing the given information as shown in the figure below.

APPEARS IN
RELATED QUESTIONS
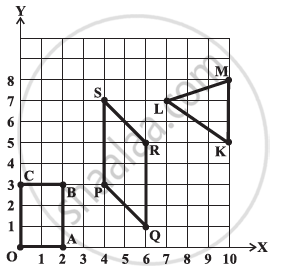
Write the coordinates of the vertices of each of these adjoining figures.

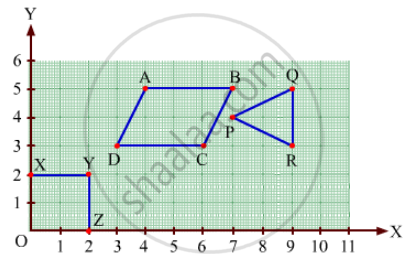
Write the coordinates of each of the vertices of each polygon in Fig. 27.9.


We need ______ coordinates for representing a point on the graph sheet.
The y-coordinate of any point lying on the x-axis will be zero.
Make a line graph for the area of a square as per the given table.
| Side (in cm) | 1 | 2 | 3 | 4 |
| Area (in cm2) | 1 | 4 | 9 | 16 |
Is it a linear graph?
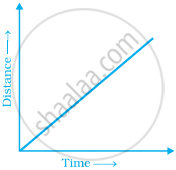
Explain the situations represented by the following distance-time graph.

Find the coordinates of the vertices of the given figures.

The graph given below compares the sales of ice creams of two vendors for a week.

Observe the graph and answer the following questions.
- Which vendor has sold more icecreams on Friday?
- For which day was the sales same for both the vendors?
- On which day did the sale of vendor A increase the most as compared to the previous day?
- On which day was the difference in sales the maximum?
- On which two days was the sales same for vendor B?
