Advertisements
Advertisements
प्रश्न
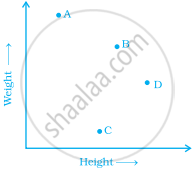
The points on the graph below represent the height and weight of the donkey, dog, crocodile, and ostrich shown in the drawing.

- What are the two variables represented in the graph?
- Which point represents each animals? Explain.
उत्तर
a. Height and weight are the two variables in the graph.
b. In the graph, we observe that the points A represents a crocodile as it has least height and greatest weight among all animals.
A – Crocodile ...[Least height, Greatest weight]
B – Donkey ...[Height and Weight more than dog]
C – Dog
D – Ostrich ...[Greatest height]
APPEARS IN
संबंधित प्रश्न
Decide which of the following statements is true and which is false. Give reasons for your answer.
A point whose y-coordinate is zero, will lie on x-axis.
We need ______ coordinates for representing a point on the graph sheet.
The process of fixing a point with the help of the coordinates is known as ______ of the point.
The distance of any point from the y-axis is the ______ coordinate.
The ordinate of a point is its distance from the y-axis.
The points (3, 5) and (5, 3) represent the same point.
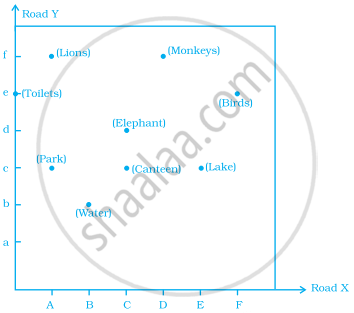
Study the given map of a zoo and answer the following questions.

- Give the location of lions in the zoo.
- (D, f) and (C, d) represent locations of which animals in the zoo?
- Where are the toilets located?
- Give the location of canteen.
Write the y-coordinate (ordinate) of the given point.
(4, 0)
Locate the points A(1, 2), B(4, 2) and C(1, 4) on a graph sheet taking suitable axes. Write the coordinates of the fourth point D to complete the rectangle ABCD.
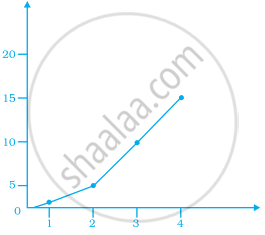
Observe the given graph carefully and complete the table given below.
| x | 1 | 2 | 3 | 4 | 5 |
| y |

