Advertisements
Advertisements
प्रश्न
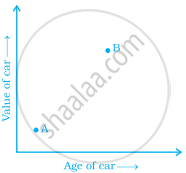
The two graphs below compare Car A and Car B. The left graph shows the relationship between age and value. The right graph shows the relationship between size and maximum speed.
 |
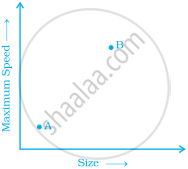 |
Use the graphs to determine whether each statement is true or false, and explain your answer.
- The older car is less valuable.
- The faster car is larger.
- The larger car is older.
- The faster car is older.
- The more valuable car is slower.
उत्तर
- False, the older car is 8 i.e. 8 valuable more than car A.
- True, in the second graph 8 is larger car having greater speed.
- True, larger car is 8 which is older than A.
- True, as 8 is faster as well as older than A.
- False, as 8 is more valuable but not slower.
APPEARS IN
संबंधित प्रश्न
In the given figure the position of the book on the table may be given by ______.
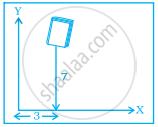
The coordinates of the origin are (0, 0).
Study the given map of a zoo and answer the following questions.
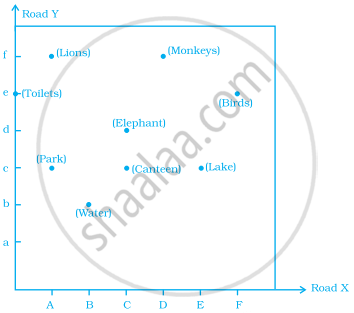
- Give the location of lions in the zoo.
- (D, f) and (C, d) represent locations of which animals in the zoo?
- Where are the toilets located?
- Give the location of canteen.
Write the x-coordinate (abscissa) of the given point.
(0, 5)
Write the y-coordinate (ordinate) of the given point.
(4, 0)
Locate the points A(1, 2), B(3, 4) and C(5, 2) on a graph sheet taking suitable axes. Write the coordinates of the fourth point D to complete the rhombus ABCD. Measure the diagonals of this rhombus and find whether they are equal or not.
The following table gives the growth chart of a child.
| Height (in cm) | 75 | 90 | 110 | 120 | 130 |
| Age (in years) | 2 | 4 | 6 | 8 | 10 |
Draw a line graph for the table and answer the questions that follow.
- What is the height at the age of 5 years?
- How much taller was the child at the age of 10 than at the age of 6?
- Between which two consecutive periods did the child grow more faster?
The following is the time-distance graph of Sneha’s walking.

- When does Sneha make the least progress? Explain your reasoning.
- Find her average speed in km/hour.
The graph given below compares the price (in Rs) and weight of 6 bags (in kg) of sugar of different brands A, B, C, D, E, F.
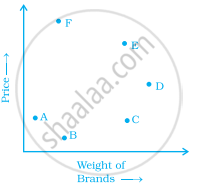
- Which brand(s) costs/cost more than Brand D?
- Bag of which brand of sugar is the heaviest?
- Which brands weigh the same?
- Which brands are heavier than brand B?
- Which bag is the lightest?
- Which bags are of the same price?
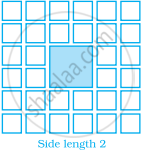
Sonal and Anmol made a sequence of tile designs from square white tiles surrounding one square purple tile. The purple tiles come in many sizes. Three of the designs are shown below.
(a) Copy and complete the table
| Side Length of Purple Titles | 1 | 2 | 3 | 4 | 5 | 10 | 100 |
| Number of white Tiles in Border |
 |
 |
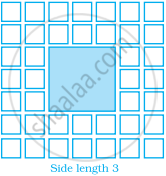 |
(b) Draw a graph using the first five pairs of numbers in your table.
(c) Do the points lie on a line?
