Advertisements
Advertisements
Question
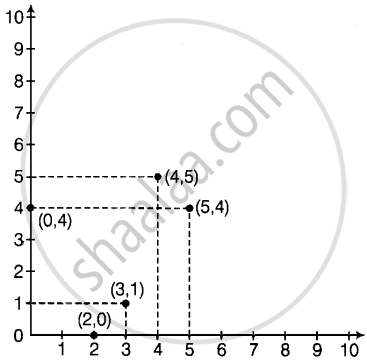
Plot the given points on a graph sheet.
- (5, 4)
- (2, 0)
- (3, 1)
- (0, 4)
- (4, 5)
Graph
Solution

shaalaa.com
Is there an error in this question or solution?
APPEARS IN
RELATED QUESTIONS
Locate the points:
(1, 3), (2, 3), (3, 3), (4, 3)
Plot the following points and verify if they lie on a line. If they lie on a line, name it.
(0, 2), (0, 5), (0, 6), (0, 3.5)
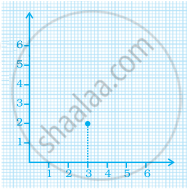
In the given graph the coordinates of point x are ______.

A point which lies on both the axis is ______.
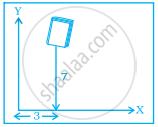
In the given figure the position of the book on the table may be given by ______.

The distance of any point from the y-axis is the ______ coordinate.
In the coordinates of a point, the second number denotes the ______.
For fixing a point on the graph sheet we need two coordinates.
Write the y-coordinate (ordinate) of the given point.
(2, 7)
Consider this input/output table.
| Input | 1 | 2 | 4 | 5 | 7 |
| Output | 2 | 5 | 11 | 14 | 20 |
- Graph the values from the table by taking Input along horizontal axis from 0 to 8 and Output along vertical axis from 0 to 24.
- Use your graph to predict the outputs for inputs of 3 and 8.
