Advertisements
Advertisements
Question
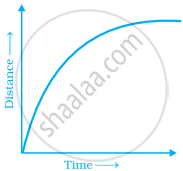
Explain the situations represented by the following distance-time graph.

Solution
Here x-axis represents time and y-axis represents distance.
In the graph, we see that the graph increases strictly with non-uniform speed and then slowly comes to the rest position.
APPEARS IN
RELATED QUESTIONS
Find the coordinates of points P, Q, R and S in Fig. 27.8.

Decide which of the following statements is true and which is false. Give reasons for your answer.
The coordinates of the origin are (0, 0).
______ displays data that changes continuously over periods of time.
Write the x-coordinate (abscissa) of the given point.
(7, 3)
Write the y-coordinate (ordinate) of the given point.
(2, 7)
Plot the given points on a graph sheet and check if the points lie on a straight line. If not, name the shape they form when joined in the given order
(1, 1), (1, 2), (2, 1), (2, 2)
Make a line graph for the area of a square as per the given table.
| Side (in cm) | 1 | 2 | 3 | 4 |
| Area (in cm2) | 1 | 4 | 9 | 16 |
Is it a linear graph?
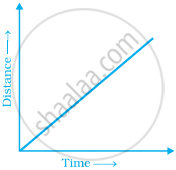
Explain the situations represented by the following distance-time graph.

Find the coordinates of the vertices of the given figures.

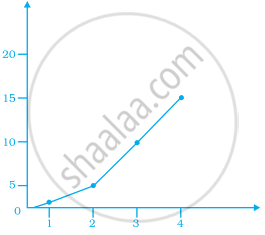
Observe the given graph carefully and complete the table given below.
| x | 1 | 2 | 3 | 4 | 5 |
| y |

