Advertisements
Advertisements
प्रश्न
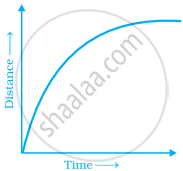
Explain the situations represented by the following distance-time graph.
उत्तर
Here x-axis represents time and y-axis represents distance.
In the graph, we see that the graph increases strictly with non-uniform speed and then slowly comes to the rest position.
APPEARS IN
संबंधित प्रश्न
State whether True or False. Correct those are false.
The coordinates of the origin are (0, 0).
Locate the points:
(2, 1), (2, 2), (2, 3), (2, 4)
The point (3, 4) is at a distance of ______.
______ displays data that changes continuously over periods of time.
We need ______ coordinates for representing a point on the graph sheet.
A point has 5 as its x–coordinate and 4 as its y–coordinate. Then the coordinates of the point are given by ______.
The distance of the point (3, 5) from the y-axis is 5.
Study the graph given below of a person who started from his home and returned at the end of the day. Answer the questions that follow.
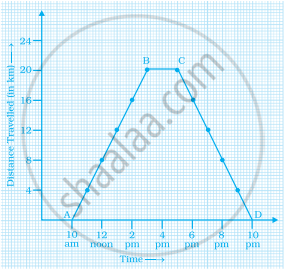
- At what time did the person start from his home?
- How much distance did he travel in the first four hours of his journey?
- What was he doing from 3 pm to 5 pm?
- What was the total distance travelled by him throughout the day?
- Calculate the distance covered by him in the first 8 hours of his journey.
- At what time did he cover 16 km of his journey?
- Calculate the average speed of the man from (a) A to B (b) B to C.
- At what time did he return home?
Draw the line graph using suitable scale to show the annual gross profit of a company for a period of five years.
| Year | 1st | 2nd | 3rd | 4th | 5th |
| Gross Profit (in Rs) |
17,00,000 | 15,50,000 | 11,40,000 | 12,10,000 | 14,90,000 |
