Advertisements
Advertisements
Question
Locate the points P(3, 4), Q(1, 0), R(0, 4), S(4, 1) on a graph sheet and write the coordinates of the point of intersection of line segments PQ and RS.
Solution
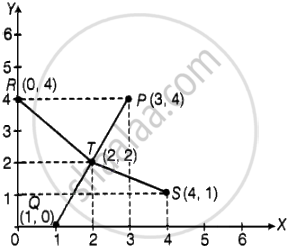
Observing the graph, we see that the line segments PQ and RS intersect at the point T(2, 2).
APPEARS IN
RELATED QUESTIONS
Locate the points:
(2, 1), (2, 2), (2, 3), (2, 4)
The following table gives the information regarding length of a side of a square and its area:
| Length of a side (in cm): | 1 | 2 | 3 | 4 | 5 |
| Area of square (in cm2): | 1 | 4 | 9 | 16 | 25 |
Draw a graph to illustrate this information.
A point which lies on both the axis is ______.
The point where the two axes intersect is called the ______.
For fixing a point on the graph sheet we need two coordinates.
The distance of any point from the x-axis is called the x-coordinate.
Match the ordinates of the points given in Column A with the items mentioned in Column B.
| Column A | Column B |
| (a) (7, 0) | (i) The ordinate is double the abscissa. |
| (b) (11, 11) | (ii) The ordinate is zero. |
| (c) (4, 8) | (iii) The ordinate is equal to the abscissa. |
| (d) (6, 2) | (iv) The abscissa is double the ordinate. |
| (e) (0, 9) | (v) The abscissa is triple the ordinate. |
| (f) (6, 3) | (vi) The abscissa is zero. |
Observe the toothpick pattern given below: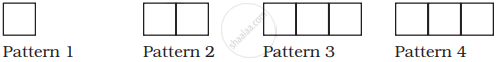
(a) Imagine that this pattern continues. Complete the table to show the number of toothpicks in the first six terms.
| Pattern | 1 | 2 | 3 | 4 | 5 | 6 |
| Toothpicks | 4 | 13 |
(b) Make a graph by taking the pattern numbers on the horizontal axis and the number of toothpicks on the vertical axis. Make the horizontal axis from 0 to 10 and the vertical axis from 0 to 30.
(c) Use your graph to predict the number of toothpicks in patterns 7 and 8. Check your answers by actually drawing them.
(d) Would it make sense to join the points on this graph? Explain.
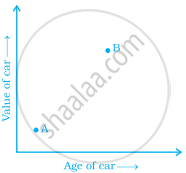
The two graphs below compare Car A and Car B. The left graph shows the relationship between age and value. The right graph shows the relationship between size and maximum speed.
 |
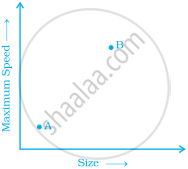 |
Use the graphs to determine whether each statement is true or false, and explain your answer.
- The older car is less valuable.
- The faster car is larger.
- The larger car is older.
- The faster car is older.
- The more valuable car is slower.
