Advertisements
Advertisements
Question
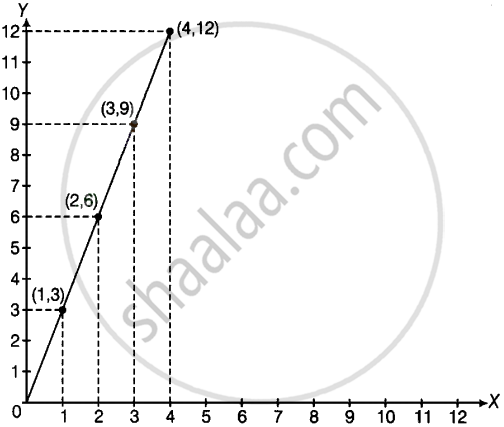
If y-coordinate is 3 times x-coordinate, form a table for it and draw a graph.
Solution
Since, the ordinate is 3 times the abscissa, we get the following values.
| x | 1 | 2 | 3 | 4 |
| y | 3 | 6 | 9 | 12 |
APPEARS IN
RELATED QUESTIONS
Draw the line passing through (2, 3) and (3, 2). Find the coordinates of the points at which this line meets the x-axis and y-axis.
State whether True or False. Correct those are false.
The coordinates of the origin are (0, 0).
The following table gives the information regarding length of a side of a square and its area:
| Length of a side (in cm): | 1 | 2 | 3 | 4 | 5 |
| Area of square (in cm2): | 1 | 4 | 9 | 16 | 25 |
Draw a graph to illustrate this information.
A point which lies on both the axis is ______.
The y-coordinate of the point (2, 4) is ______.
The ordinate of a point is its distance from the y-axis.
Plot the given points on a graph sheet and check if the points lie on a straight line. If not, name the shape they form when joined in the given order
(1, 1), (1, 2), (2, 1), (2, 2)
The table given below shows the temperatures recorded on a day at different times.
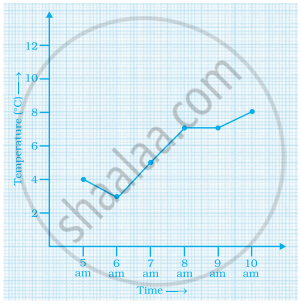
Observe the table and answer the following questions.
- What is the temperature at 8 am?
- At what time is the temperature 3°C?
- During which hour did the temperature fall?
- What is the change in temperature between 7 am and 10 am?
- During which hour was there a constant temperature?
Consider this input/output table.
| Input | 1 | 2 | 4 | 5 | 7 |
| Output | 2 | 5 | 11 | 14 | 20 |
- Graph the values from the table by taking Input along horizontal axis from 0 to 8 and Output along vertical axis from 0 to 24.
- Use your graph to predict the outputs for inputs of 3 and 8.
