Advertisements
Advertisements
प्रश्न
Find the median of:
63, 17, 50, 9, 25, 43, 21, 50, 14 and 34
उत्तर
Firstly arrange the numbers in ascending order
9, 14. 17, 21, 25, 34, 43, 50, 50, 63
Now since n = 10( even )
Median =`1/2 [ "value of"( n / 2 )^"th" "term" + "value of" ((n)/(2) + 1)^"th" "term" ]`
=`1/2 [ "value of"( 10 / 2 )^"th" "term" + "value of" (( 10 )/(2) + 1)^"th" "term" ]`
= `1/2 [ 25 + 34 ]`
= `1/2 [ 59 ]`
= 29.5
Thus the median is 29.5.
APPEARS IN
संबंधित प्रश्न
From the data given below, calculate the mean wage, correct to the nearest rupee.
| Category | A | B | C | D | E | F |
| Wages (Rs/day) | 50 | 60 | 70 | 80 | 90 | 100 |
| No. of workers | 2 | 4 | 8 | 12 | 10 | 6 |
- If the number of workers in each category is doubled, what would be the new mean wage?
- If the wages per day in each category are increased by 60%; what is the new mean wage?
- If the number of workers in each category is doubled and the wages per day per worker are reduced by 40%, what would be the new mean wage?
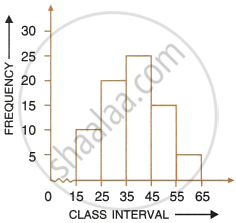
Using the information given in the adjoining histogram, calculate the mean.

The marks of 200 students in a test were recorded as follows:
| Marks | No. of students |
| 10-19 | 7 |
| 20-29 | 11 |
| 30-39 | 20 |
| 40-49 | 46 |
| 50-59 | 57 |
| 60-69 | 37 |
| 70-79 | 15 |
| 80-89 | 7 |
Construct the cumulative frequency table. Drew the ogive and use it too find:
(1) the median and
(2) the number of student who score more than 35% marks.
The distribution, given below, shows the marks obtained by 25 students in an aptitude test. Find the mean, median and mode of the distribution.
| Marks obtained | 5 | 6 | 7 | 8 | 9 | 10 |
| No. of students | 3 | 9 | 6 | 4 | 2 | 1 |
Find the mean of all odd numbers from 5 to 20. Find the new mean when each number is multiplied by 4.
If different values of variable x are 19.8, 15.4, 13.7, 11.71, 11.8, 12.6, 12.8, 18.6, 20.5 and 2.1, find the mean.
If the mean of 6, 4, 7, p and 10 is 8, find the value of p.
The mean of 5 numbers is 27. If one new number is included, the new mean is 25. Find the included number.
Find the median of 25, 16, 15, 10, 8, 30
The measures of central tendency may not lie between the maximum and minimum values of data.
