Advertisements
Advertisements
प्रश्न
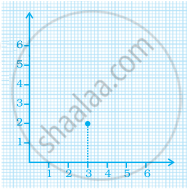
For the point (5, 2), the distance from the x-axis is ______ units.
उत्तर
For the point (5, 2), the distance from the x-axis is 2 units.
Explanation:
We know that, the y-coordinate represents the distance of the point from the x-axis.
Hence, the point (5, 2) is at a distance of 2 units from the x-axis.
APPEARS IN
संबंधित प्रश्न
Plot the following points on a graph sheet. Verify if they lie on a line
P(1, 1), Q(2, 2), R(3, 3), S(4, 4)
Plot the points (5, 0), (5, 1), (5, 8). Do they lie on a line? What is your observation?
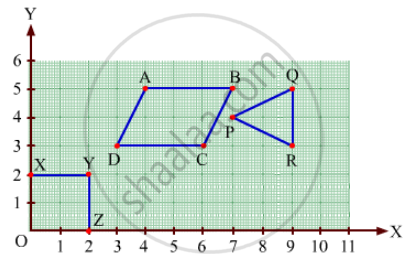
Write the coordinates of each of the vertices of each polygon in Fig. 27.9.

In the given graph the coordinates of point x are ______.

In the given graph the letter that indicates the point (0, 3) is ______.

In the coordinates of a point, the second number denotes the ______.
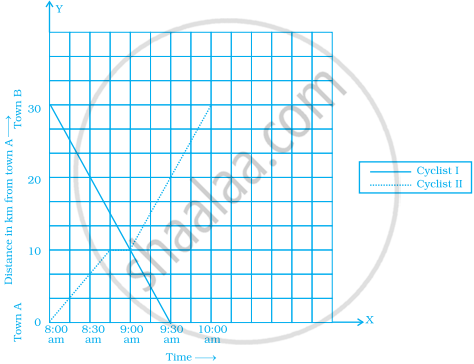
The following graph shows the journey made by two cyclists, one from town A to B and the other from town B to A.
- At what time did cyclist II rest? How long did the cyclist rest?
- Was cyclist II cycling faster or slower after the rest?
- At what time did the two cyclists meet?
- How far had cyclist II travelled when he met cyclist I?
- When cyclist II reached town A, how far was cyclist I from town B?

Draw the line graph using suitable scale to show the annual gross profit of a company for a period of five years.
| Year | 1st | 2nd | 3rd | 4th | 5th |
| Gross Profit (in Rs) |
17,00,000 | 15,50,000 | 11,40,000 | 12,10,000 | 14,90,000 |
Observe the toothpick pattern given below:
(a) Imagine that this pattern continues. Complete the table to show the number of toothpicks in the first six terms.
| Pattern | 1 | 2 | 3 | 4 | 5 | 6 |
| Toothpicks | 4 | 13 |
(b) Make a graph by taking the pattern numbers on the horizontal axis and the number of toothpicks on the vertical axis. Make the horizontal axis from 0 to 10 and the vertical axis from 0 to 30.
(c) Use your graph to predict the number of toothpicks in patterns 7 and 8. Check your answers by actually drawing them.
(d) Would it make sense to join the points on this graph? Explain.
