Advertisements
Advertisements
प्रश्न
Histogram is a graph of a ________ frequency distribution
पर्याय
continuous
discontinuous
discrete
none of these
उत्तर
Histogram is a graph of a continuous frequency distribution
APPEARS IN
संबंधित प्रश्न
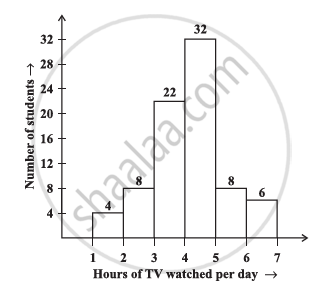
The number of hours for which students of a particular class watched television during holidays is shown through the given graph.
Answer the following
1) For how many hours did the maximum number of students watch TV?
2) How many students watched TV for less than 4 hours?
3) How many students spent more than 5 hours in watching TV?
Time alloted for the preparation of an examination by some students is shown in the table. Draw a histogram to show the information.
| Time (minutes) | 60 - 80 | 80 - 100 | 100 - 120 | 120 - 140 | 140 - 160 |
| No. of students | 14 | 20 | 24 | 22 | 16 |
Observe the following frequency polygon and write the answers of the questions below it.
- Which class has the maximum number of students?
- Write the classes having zero frequency.
- What is the class-mark of the class, having frequency of 50 students?
- Write the lower and upper class limits of the class whose class mark is 85.
- How many students are in the class 80-90?
Construct histograms for following frequency distribution:
| Class Mark | 6 | 12 | 18 | 24 | 30 | 36 |
| Frequency | 8 | 12 | 15 | 18 | 25 | 7 |
Distribution of height in cm of 100 people is given below:
| Class interval (cm) | Frequency |
| 145 - 155 | 3 |
| 155 - 165 | 35 |
| 165 - 175 | 25 |
| 175 - 185 | 15 |
| 185 - 195 | 20 |
| 195 - 205 | 2 |
Draw a histogram to represent the above data.
Draw a histogram and frequency polygon to represent the following data (on the same scale) which shows the monthly cost of living index of a city in a period of 2 years:
| Cost of living Index | Number of months |
| 440 - 460 | 2 |
| 460 - 480 | 4 |
| 480 - 500 | 3 |
| 500 - 520 | 5 |
| 520 - 540 | 3 |
| 540 - 560 | 2 |
| 560 - 580 | 1 |
| 580 - 600 | 4 |
| Total | 24 |
Draw a histogram for the following data.
| Mid Value (x) | 15 | 25 | 35 | 45 | 55 | 65 | 75 |
| Frequency (f) | 12 | 24 | 30 | 18 | 26 | 10 | 8 |
The number of people owning books more than 60 is ______.
The following pictorial representation of data is a histogram.
Draw a histogram to represent the frequency distribution in question 91.
