Advertisements
Advertisements
प्रश्न
Histogram shows the number of people owning the different number of books. Answer the question based on it.
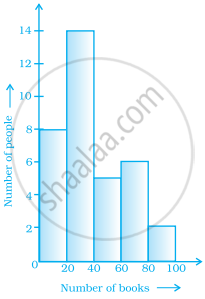
The number of people owning books more than 60 is ______.
उत्तर
The number of people owning books more than 60 is 8.
Explanation:
Number of people owning books more than 60 = 6 + 2
⇒ Number of people owning books more than 60 = 8
APPEARS IN
संबंधित प्रश्न
Draw the frequency polygon for the following frequency distribution
| Rainfall (in cm) | No. of Years |
| 20 — 25 | 2 |
| 25 — 30 | 5 |
| 30 — 35 | 8 |
| 35 — 40 | 12 |
| 40 — 45 | 10 |
| 45 — 50 | 7 |
Represent the following data by Histogram:
|
Price of Sugar per kg (in Rs.) |
Number of Weeks |
| 18-20 | 4 |
| 20-22 | 8 |
| 22-24 | 22 |
| 24-26 | 12 |
| 26-28 | 8 |
| 28-30 | 6 |
The following is the frequency distribution of waiting time at ATM centre; draw histogram to represent the data:
| Waiting time (in seconds) |
Number of Customers |
| 0 -30 | 15 |
| 30 - 60 | 23 |
| 60 - 90 | 64 |
| 90 - 120 | 50 |
| 120 - 150 | 5 |
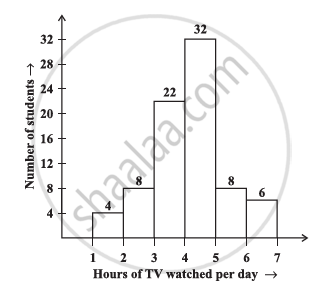
The number of hours for which students of a particular class watched television during holidays is shown through the given graph.
Answer the following
1) For how many hours did the maximum number of students watch TV?
2) How many students watched TV for less than 4 hours?
3) How many students spent more than 5 hours in watching TV?
The histogram below represents the scores obtained by 25 students in a mathematics mental test. Use the data to:
- Frame a frequency distribution table.
- To calculate mean.
- To determine the Modal class.

Draw histogram for the following frequency distributions:
| Class Interval | 10 – 16 | 16 – 22 | 22 – 28 | 28 – 34 | 34 – 40 |
| Frequency | 15 | 23 | 30 | 20 | 16 |
The table below shows the yield of jowar per acre. Show the data by histogram.
| Yield per acre (quintal) | 2 - 3 | 4 - 5 | 6 - 7 | 8 - 9 | 10 - 11 |
| No. of farmers | 30 | 50 | 55 | 40 | 20 |
| Electricity bill (₹) | 0 - 200 | 200 - 400 | 400 - 600 | 600 - 800 | 800 - 1000 |
| Families | 240 | 300 | 450 | 350 | 160 |
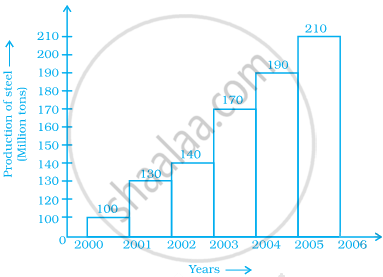
Number of workshops organized by a school in different areas during the last five years are as follows:
| Years | No. of workshops |
| 1995−1996 | 25 |
| 1996−1997 | 30 |
| 1997−1998 | 42 |
| 1998−1999 | 50 |
| 1999−2000 | 65 |
Draw a histogram representing the above data.
Below is the histogram depicting marks obtained by 43 students of a class:
(i) Write the number of students getting the highest marks.
(ii) What is the class size?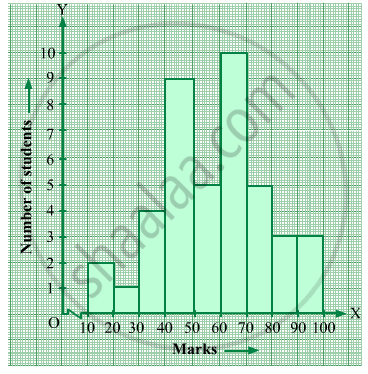
The following frequency distribution table shows marks obtained by 180 students in Mathematics examination.
| Marks | No. of students |
| 0 – 10 | 25 |
| 10 – 20 | x |
| 20 – 30 | 30 |
| 30 – 40 | 2x |
| 40 – 50 | 65 |
Find the value of x. Also draw a histogram representing the above information.
Construct histograms for following frequency distribution:
| Class Interval | 130-140 | 140-150 | 150-160 | 160-170 | 170-180 |
| Frequency | 24 | 16 | 29 | 20 | 11 |
Draw the Histogram and hence, the frequency polygon for the following frequency distribution:
| House Rent (In ₹ per month) | 400-600 | 600-800 | 800-1000 | 1000-1200 |
| Number of families | 200 | 240 | 300 | 50 |
Histogram is a graph of a ________ frequency distribution
Draw a histogram and the frequency polygon in the same diagram to represent the following data
| Weight (in kg) | 50 − 55 | 56 − 61 | 62 − 67 | 68 − 73 | 74 − 79 | 80 − 85 | 86 − 91 |
| No. of persons | 15 | 8 | 12 | 17 | 9 | 10 | 6 |
From the histogram given on the right, we can say that 1500 males above the age of 20 are literate.
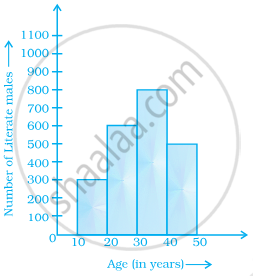
The following pictorial representation of data is a histogram.
Look at the histogram below and answer the questions that follow.
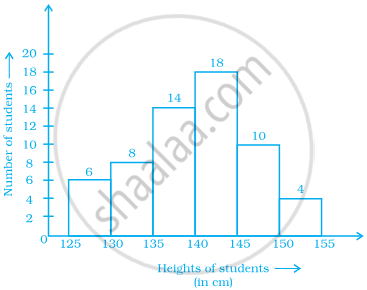
- How many students have height more than or equal to 135 cm but less than 150 cm?
- Which class interval has the least number of students?
- What is the class size?
- How many students have height less than 140 cm?
The following table shows the classification of percentage of marks of students and the number of students. Draw frequency polygon from the table without drawing histogram:
| Result (Percentage) | Number of Students |
| 20 - 40 | 25 |
| 40 - 60 | 65 |
| 60 - 80 | 80 |
| 80 - 100 | 15 |
