Advertisements
Advertisements
प्रश्न
Histogram shows the number of people owning the different number of books. Answer the question based on it.
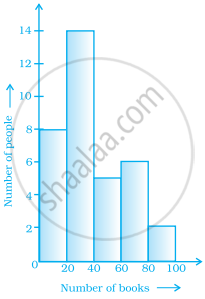
The number of people owning books less than 40 is ______.
उत्तर
The number of people owning books less than 40 is 22.
Explanation:
Number of people owning books less than 40 = 8 + 14
⇒ Number of people owning books less than 40 = 22
APPEARS IN
संबंधित प्रश्न
The marks scored by students in Mathematics in a certain Examination are given below:
| Marks Scored | Number of Students |
| 0 — 20 | 3 |
| 20 — 40 | 8 |
| 40 — 60 | 19 |
| 60 — 80 | 18 |
| 80 — 100 | 6 |
Draw histogram for the above data.
Represent the following data by Histogram:
|
Price of Sugar per kg (in Rs.) |
Number of Weeks |
| 18-20 | 4 |
| 20-22 | 8 |
| 22-24 | 22 |
| 24-26 | 12 |
| 26-28 | 8 |
| 28-30 | 6 |
Draw histogram for the following frequency distributions:
| Class Interval | 10 – 16 | 16 – 22 | 22 – 28 | 28 – 34 | 34 – 40 |
| Frequency | 15 | 23 | 30 | 20 | 16 |
| Result (Percentage) | 30 - 40 | 40 - 50 | 50 - 60 | 60 -70 | 70 - 80 | 80 - 90 | 90 - 100 |
| No. of students | 7 | 33 | 45 | 65 | 47 | 18 | 5 |
Find the correct answer from the alternatives given.
|
No. of trees planted by each student |
1 - 3 | 4 - 6 | 7 - 9 | 10 - 12 |
| No. of students | 7 | 8 | 6 | 4 |
The above data is to be shown by a frequency polygon. The coordinates of the points to show number of students in the class 4-6 are . . . .
The following table is based on the marks of the first term examination of 10th class students. Show the information by a histogram. Also, draw a frequency polygon with the help of the histogram.
| Class-mark of marks | 325 | 375 | 425 | 475 | 525 | 575 |
| No. of students | 25 | 35 | 45 | 40 | 32 | 20 |
Given below is the frequency distribution of the heights of 50 students of a class:
| Class interval: | 140−145 | 145−150 | 150−155 | 155−160 | 160−165 |
| Frequency: | 8 | 12 | 18 | 10 | 5 |
Draw a histogram representing the above data.
Construct a histogram for the following data:
| Monthly school fee (in Rs): | 30−60 | 60−90 | 90−120 | 120−150 | 150−180 | 180−210 | 210−240 |
| Number of schools: | 5 | 12 | 14 | 18 | 10 | 9 | 4 |
Draw a histogram to represent the following data:
| Monthly salary (in Rs) | Number of teachers |
| 5600−5700 | 8 |
| 5700−5800 | 4 |
| 5800−5900 | 3 |
| 5900−6000 | 5 |
| 6000−6100 | 2 |
| 6100−6200 | 3 |
| 6200−6300 | 1 |
| 6300−6400 | 2 |
Construct histograms for following frequency distribution:
| Class Interval | 110-119 | 120-129 | 130-139 | 140-149 | 150-159 |
| Frequency | 15 | 23 | 30 | 20 | 16 |
The marks scored by students in Mathematics in a certain examination are given below :
| Marks Scored | Number of Students |
| 0 - 20 | 6 |
| 20 - 40 | 9 |
| 40 - 60 | 14 |
| 60 - 80 | 16 |
| 80 - 100 | 5 |
Draw histogram for the above data.
Draw the histogram for the following frequency distribution and hence estimate the mode for the distribution.
| Class | Frequency |
| 0 - 5 | 2 |
| 5 - 10 | 7 |
| 10 - 15 | 18 |
| 15 - 20 | 10 |
| 20 - 25 | 8 |
| 25 - 30 | 5 |
| Total | 24 |
The total area of the histogram is _________ to the total frequency of the given data
Histogram is a graphical representation of ___________ data
The graphical representation of grouped data is _________
Draw a histogram and the frequency polygon in the same diagram to represent the following data
| Weight (in kg) | 50 − 55 | 56 − 61 | 62 − 67 | 68 − 73 | 74 − 79 | 80 − 85 | 86 − 91 |
| No. of persons | 15 | 8 | 12 | 17 | 9 | 10 | 6 |
Form a continuous frequency distribution table and draw histogram from the following data.
| Age (in years) | No. of persons |
| Under 5 | 1 |
| Under 10 | 12 |
| Under 15 | 19 |
| Under 20 | 26 |
| Under 25 | 27 |
| Under 30 | 35 |
| Under 35 | 38 |
| Under 40 | 45 |
| Under 45 | 48 |
| Under 50 | 53 |
Draw a histogram for the following data.
| Mid Value (x) | 15 | 25 | 35 | 45 | 55 | 65 | 75 |
| Frequency (f) | 12 | 24 | 30 | 18 | 26 | 10 | 8 |
The following pictorial representation of data is a histogram.
The given graph with a histogram represents the number of plants of different heights grown in a school campus. Study the graph carefully and answer the following questions:
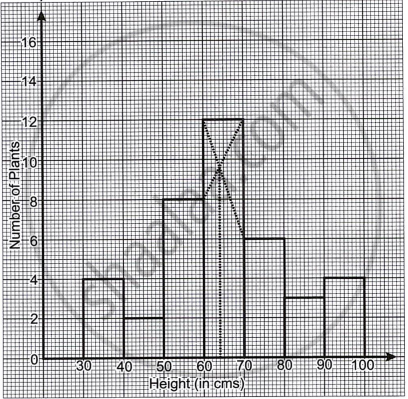
- Make a frequency table with respect to the class boundaries and their corresponding frequencies.
- State the modal class.
- Identify and note down the mode of the distribution.
- Find the number of plants whose height range is between 80 cm to 90 cm.
